. 2016 Jan 28:7:10503.
doi: 10.1038/ncomms10503.

Serotonin neurons in the dorsal raphe nucleus encode reward signals

Affiliations

Serotonin neurons in the dorsal raphe nucleus encode reward signals

Yi Li et al. Nat Commun. .

Abstract

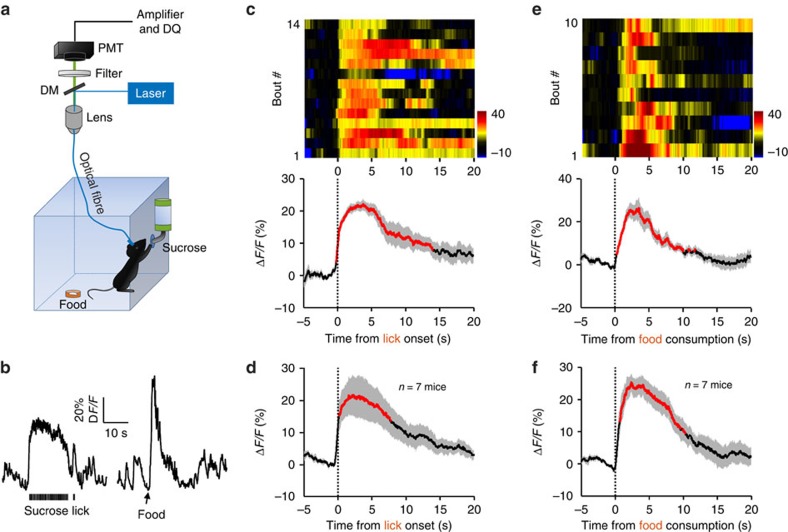
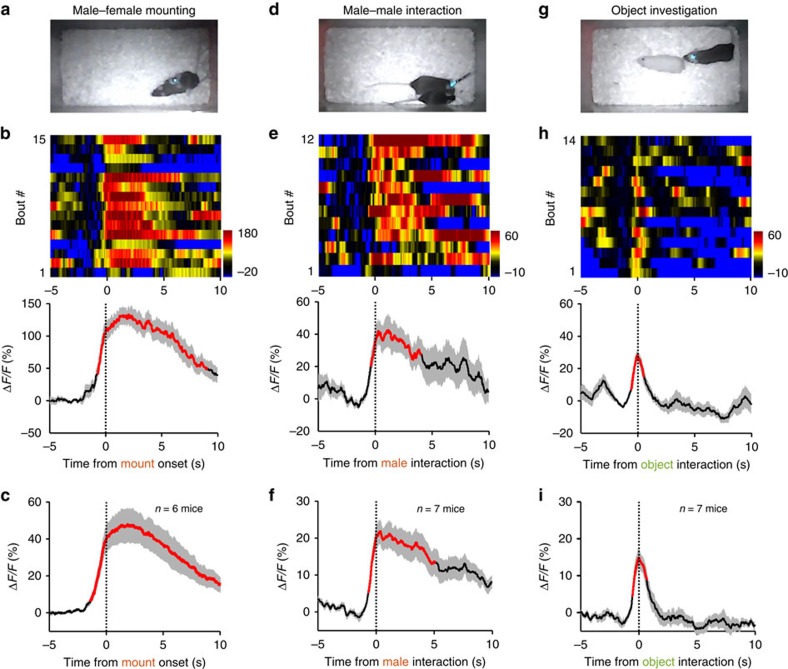
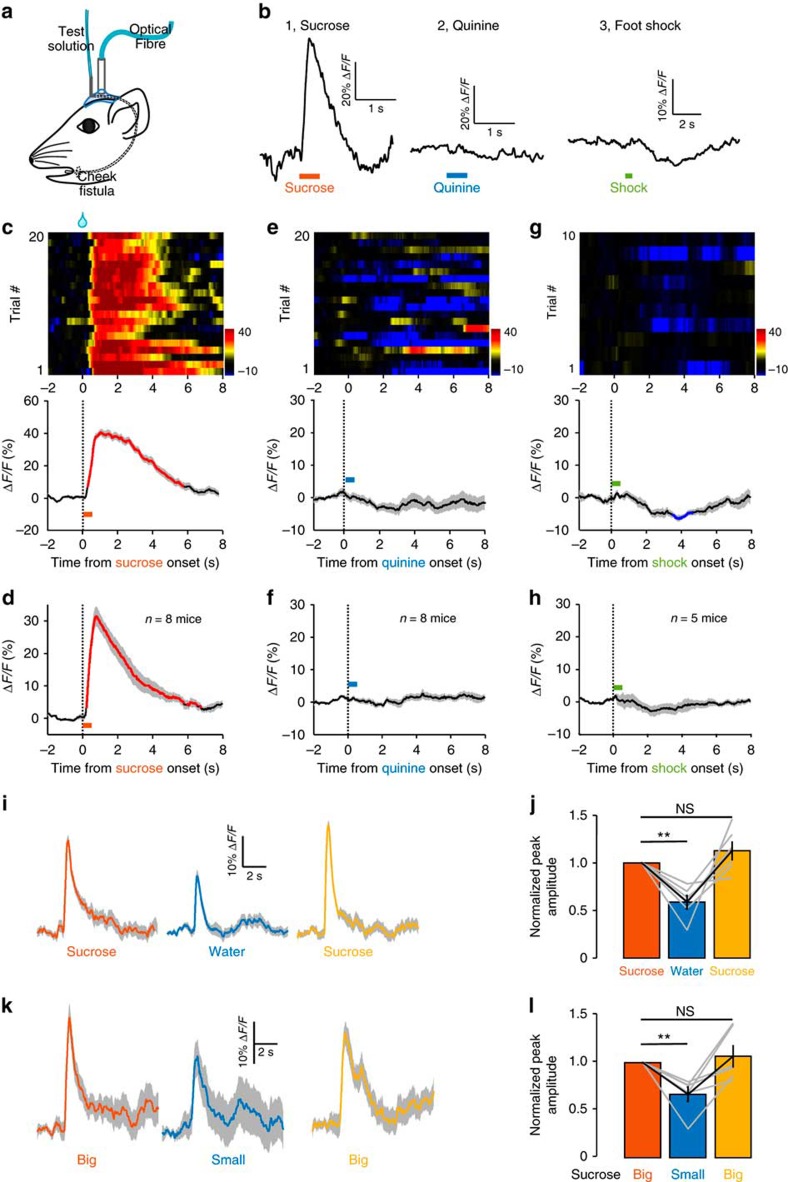
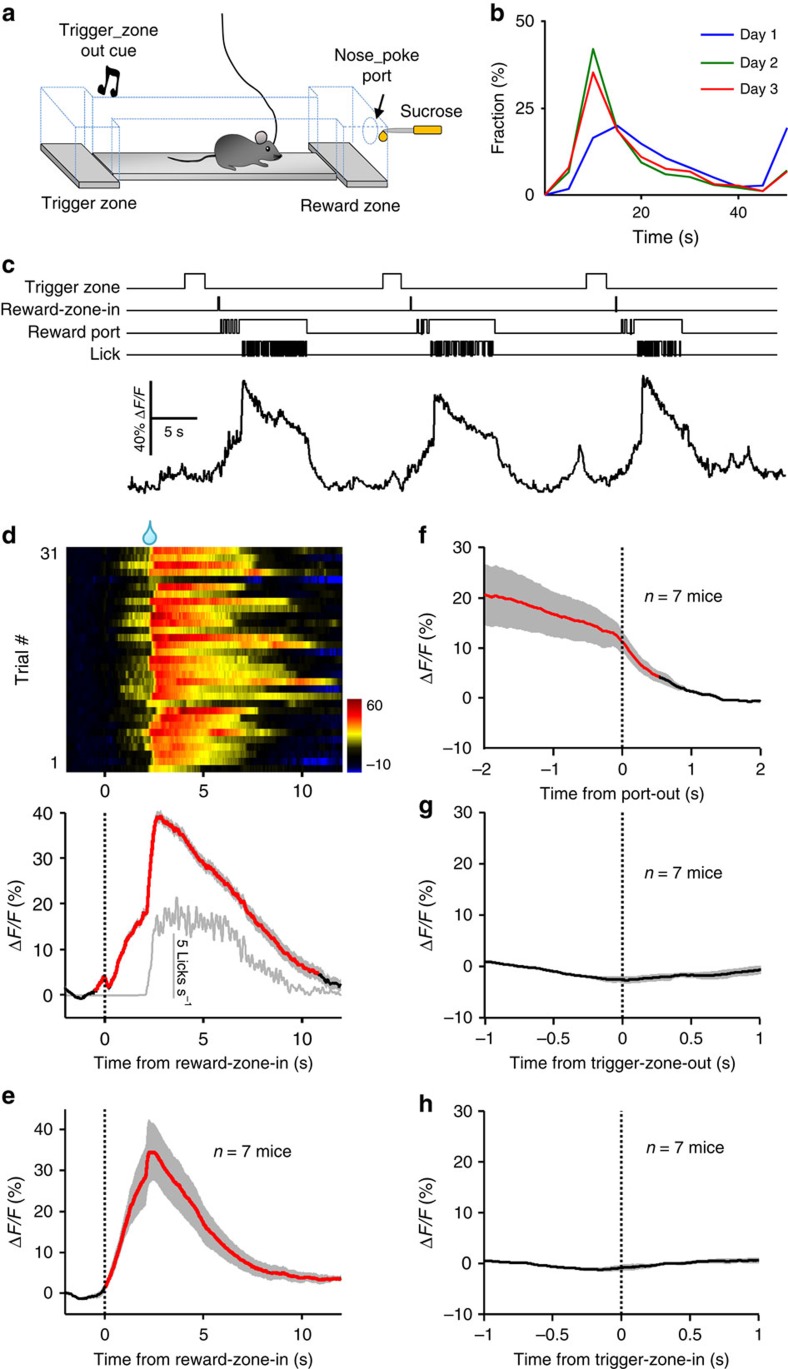
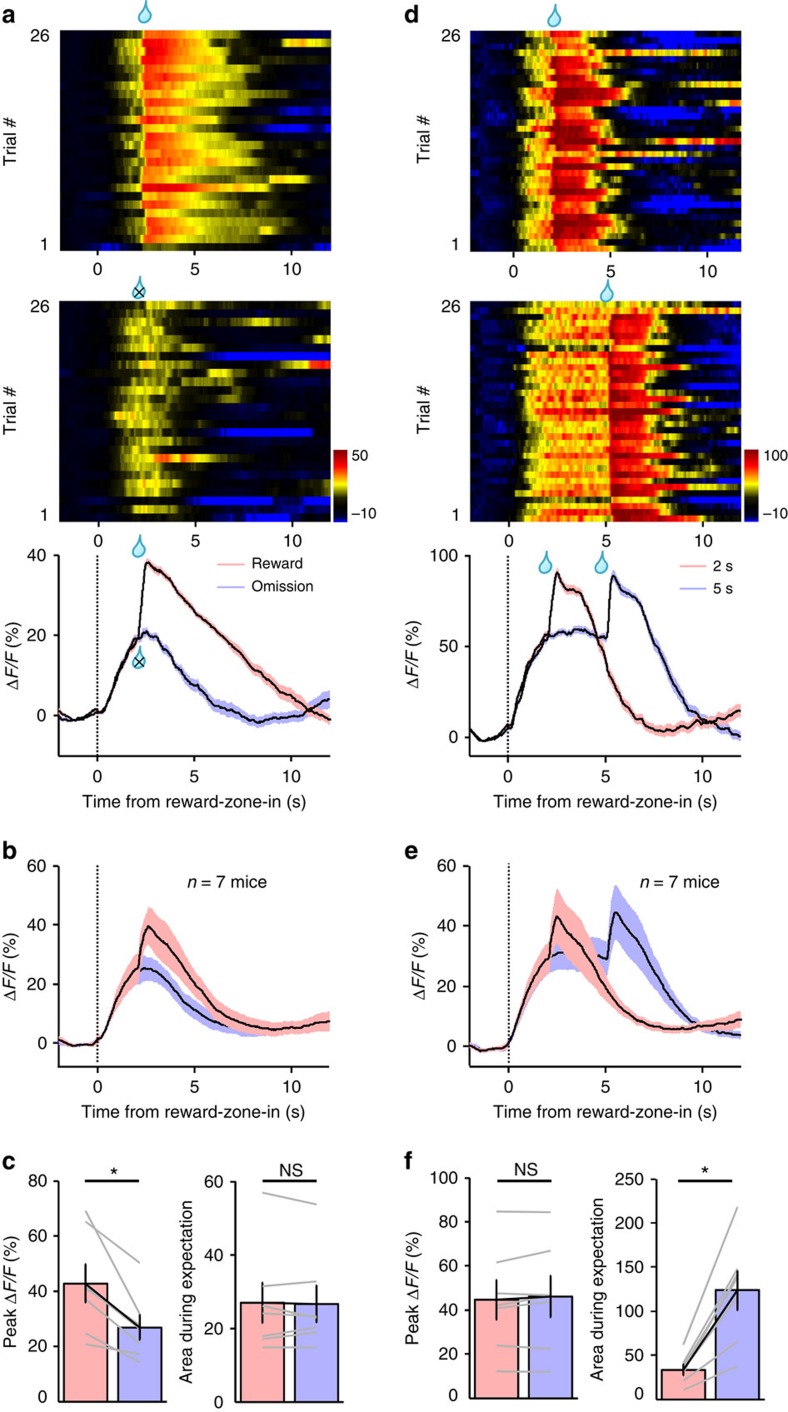
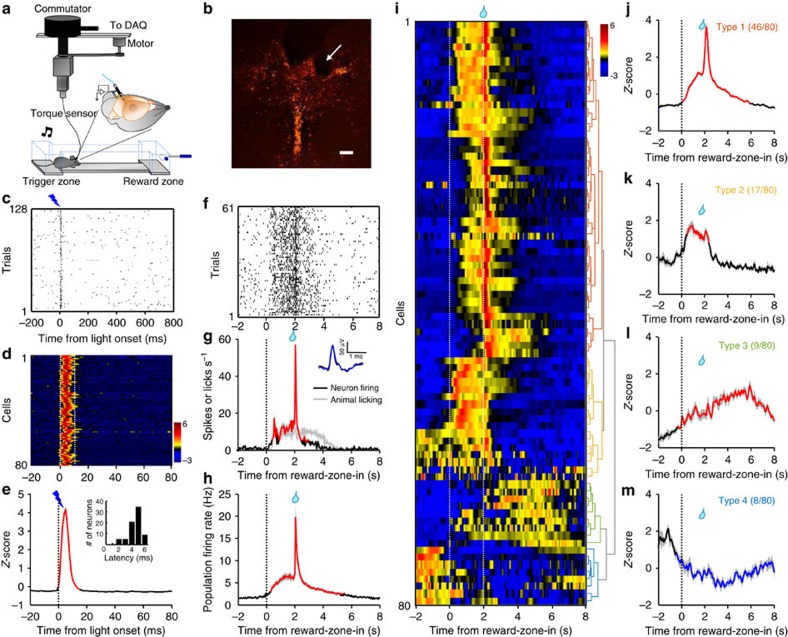
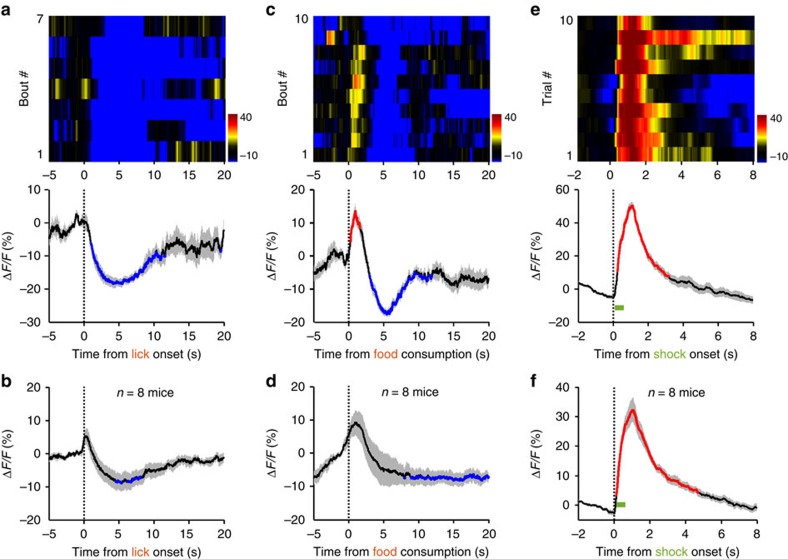
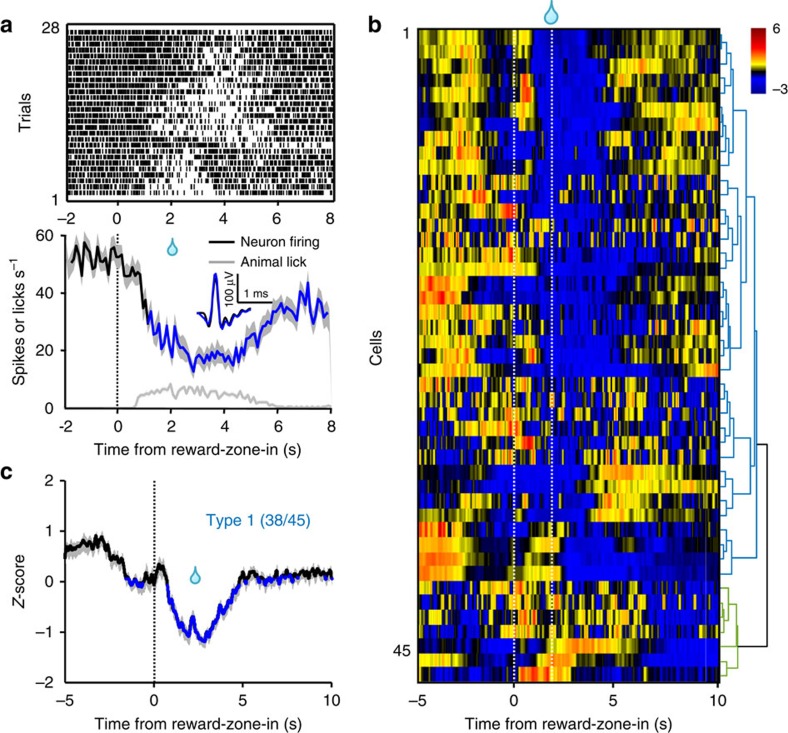
The dorsal raphe nucleus (DRN) is involved in organizing reward-related behaviours; however, it remains unclear how genetically defined neurons in the DRN of a freely behaving animal respond to various natural rewards. Here we addressed this question using fibre photometry and single-unit recording from serotonin (5-HT) neurons and GABA neurons in the DRN of behaving mice. Rewards including sucrose, food, sex and social interaction rapidly activate 5-HT neurons, but aversive stimuli including quinine and footshock do not. Both expected and unexpected rewards activate 5-HT neurons. After mice learn to wait for sucrose delivery, most 5-HT neurons fire tonically during waiting and then phasically on reward acquisition. Finally, GABA neurons are activated by aversive stimuli but inhibited when mice seek rewards. Thus, DRN 5-HT neurons positively encode a wide range of reward signals during anticipatory and consummatory phases of reward responses. Moreover, GABA neurons play a complementary role in reward processing.


Figures

Figure 1
Figure 1. Sucrose lick and food intake increase Ca2+ signals of DRN 5-HT neurons.
(a) Schematic of the fibre photometry setup. Ca2+ transients were recorded from GCaMP6-expressing DRN 5-HT neurons of SERT-Cre mice that had free access to sucrose solution and food pellets in a test chamber. DM, dichroic mirror; PMT, photomultiplier tube. (b) Raw traces of GCaMP6 fluorescence changes that were associated with sucrose lick and food intake. ΔF/F represents change in fluorescence from the mean level before the task. (c) Ca2+ signals associated with bouts of sucrose lick in a behavioural session. Upper panel, the heatmap illustration of Ca2+ signals aligned to the initiation of sucrose licking bouts. Each row plots one bout and a total of 14 bouts are illustrated. Colour scale at the right indicates ΔF/F. Lower panel, the peri-event plot of the average Ca2+ transients and lick frequency. Thick lines indicate mean and shaded areas indicate s.e.m. Red segments indicate statistically significant increase from the baseline (P<0.05; permutation test). (d) Mean Ca2+ transients associated with sucrose lick for the entire test group (n=7 mice). (e,f) Ca2+ transients elicited by food intake (n=7 mice). Data from ten bouts are plotted in e. Same conventions as in c and d.
Figure 2
Figure 2. Social rewards activate DRN 5-HT neurons.
(ac) Ca2+ signals associated with mating behaviour of male mice. A SERT-DRNGCaMP6 male mouse mounted a female following the introduction of the receptive female into the home cage of the male (a). Heatmap of Ca2+ transients and average plots show that mounting a female resulted in significant increase of Ca2+ across multiple behavioural bouts of a male mouse (b) and for the entire test group (c, n=6 mice). Thick lines indicate mean and shaded areas indicate s.e.m. Red lines indicate significant increase (P<0.05; permutation test). (df) Ca2+ signals associated with male–male interaction. GCaMP signals were recorded when a test male performed chemoinvestigation of an intruder male. Same conventions as in ac. n=7 SERT-DRNGCaMP6 male mice in f. (gi) Ca2+ signals associated with investigation of a neutral object. An inanimate dummy mouse was introduced into the home cage of a test male (g). n=7 SERT-DRNGCaMP6 male mice in i.
Figure 3
Figure 3. DRN 5-HT neurons are activated by unexpected delivery of sucrose but not aversive stimuli.
(a) Schematics of recording Ca2+ signals in response to intraoral solution delivery through a cheek fistula. (b) Representative raw traces of GCaMP fluorescence changes to random delivery of sucrose (b1), quinine (b2) and footshock (b3). Ca2+ response patterns of DRN 5-HT neurons from a representative mouse (c) and the entire test group (d, n=8 SERT-DRNGCaMP6 mice). Sucrose solution was randomly infused through a cheek fistula for 20 trials in one behavioural session. Ca2+ transients were aligned to the onset of 0.5 s infusion. Lines indicate average and the shaded area indicate s.e.m. Red lines represent statistically significant increase from the base line (P<0.05; permutation test). GCaMP fluorescence change to intraoral delivery of quinine for one mouse (e) and the test group (f, n=8 SERT-DRNGCaMP6 mice). Footshock-associated Ca2+ signals from a representative mouse (g) and the test group (h, n=5 SERT-DRNGCaMP6 mice). Blue line in g indicate significant decrease. (i) The GCaMP signals of 30 consecutive trials were averaged for sucrose (5%), pure water and sucrose again (5%). (j) Summary of data on the effect of replace sucrose with water. **P<0.01; NS, not significant; multiple comparisons after repeated measures one-way analysis of variance (ANOVA); n=6 mice. Error bars indicate s.e.m. (k,l) Effects of reward size. Same conventions as in i and j, except that big reward consisted of 8 μl 5% sucrose in 0.5 s and small reward had only half volume (2 μl in 0.5 s). Error bars in l indicate s.e.m.
Figure 4
Figure 4. Ca2+ transients of DRN 5-HT neurons during a sucrose foraging task.
(a) Schematics of the behavioural task. A mouse ran from the trigger zone to the reward zone and poked its nose through the reward port for delayed delivery of sucrose. (b) Distribution of trial duration between exit from the trigger zone and return from the reward zone for daily behavioural sessions. (c) Raw trace of Ca2+ transients from a SERT-DRNGCaMP6 mouse during the sucrose foraging task. Sucrose was delivered with 2 s delay following reward-zone entry. TTL signals above the Ca2+ trace indicate various behavioural events. (d) Example heatmap (top) and peri-event plots (bottom) of fluorescence changes aligned to mouse entries to the reward zone (reward-zone-in). Each row in the heatmap draws the data from one behavioural trial and a total of 31 trials are plotted. The grey line in the lower panel indicates lick rates. Thick lines indicate mean and shaded areas indicate s.e.m. Red segment indicates significant increase (P<0.05; permutation test). (e) Population data on the mean Ca2+ transients of DRN 5-HT neurons following reward-zone-in events (n=7 SERT-DRNGCaMP6 mice). Mean Ca2+ signals aligned to the termination of nose pokes through the reward port (f), trigger-zone-out events (g) and trigger-zone-in events (h). n=7 SERT-DRNGCaMP6 mice.
Figure 5
Figure 5. In trained mice, DRN 5-HT neurons are activated during reward waiting and following reward acquisition.
(ac) The effect of sucrose omission on Ca2+ signals. Sucrose solution was randomly omitted for half of trials in a sucrose foraging session. The heatmap in a illustrates the GCaMP signals of a representative mouse for sorted trials of sucrose delivery (upper) and sucrose omission (lower). The plots show the average Ca2+ signals of the single mouse (a) and the entire test group (b, n=7 mice). Thick lines indicate mean and shaded areas indicate s.e.m. The bar graphs in c show that sucrose omission significantly reduced Ca2+ signal amplitude associated with scheduled sucrose delivery (left) but did not affect the Ca2+ signal during reward delay (right). Lines indicate data from individual mice. *P<0.05; NS, not significant; Wilcoxon's signed-rank tests. n=7 mice. (df) The effect of extending the delay length on Ca2+ signals. Trials were randomly assigned with the delay of either 2 or 5 s in the same test session. The Ca2+ response of a single mouse is shown in d and the population response is shown in e. *P<0.05; NS, not significant; Wilcoxon's signed-rank tests. n=7 mice.
Figure 6
Figure 6. Spike firing pattern of individual 5-HT neurons during the foraging task.
(a) The method of optetrode recording from DRN 5-HT neurons of freely behaving mice. Torque signals from the recording cable controlled a motorized commutator to ease mouse movement. (b) The location of electrolytic lesion, pointing to a recording site within the DRN of a SERT-DRNChR2 mouse. Red, ChR2-mCherry. Scale bar, 200 μm. (ce) The method of optogenetic tagging. The raster plot in c shows the effect of single light pulses (5 ms) on evoking spike firing from a single cell. Each line indicates a 1-s trial. Heatmap in d shows the Z-score representation of light-evoked spiking activity for all identified 5-HT neurons (n=80 cells). Each line plots the response of one cell. Dash lines delineate 10-ms interval following light onset. (e) Average Z-scores of spike firing rates (n=80 cells). Inset in e plots the distribution histogram of spike latency. (f,g) Spike firing activity of one representative 5-HT neuron. The raster plot in f is derived from the firing activity across trials for the same cell shown in c. Thick lines indicate mean and shaded areas indicate s.e.m. The PETH (smoothed with a Gaussian kernel with σ of 50 ms) of spike firing rates (red) and lick rates (grey) are aligned to the reward-zone-in event (g). Inset illustrates the waveform overlay of average spontaneous spikes (black) and average light-evoked spikes (blue). (h) Mean PETH of spike firing rates of all identified 5-HT neurons (n=80 cells). (i) The activity patterns of individual 5-HT neurons. The PETHs of Z-scored spike firing rates are represented in the heatmap format (colorscale at the top right). Each row indicates the activity pattern of one cell aligned to the reward-zone-in event (the left dash line). The right dash line indicates sucrose delivery. Data were hierarchically clustered based on the first three major principal components of Z-scores (dendrogram at the right). Cluster colours denote the four major response subtypes based on the cluster analysis. (jm) Mean Z-scores of the four subtypes of 5-HT neurons. Red indicates significant increase and blue indicates significant decrease from the baseline (P<0.05; permutation test). Shaded areas indicate s.e.m.
Figure 7
Figure 7. The effects of appetitive and aversive stimuli on the Ca2+ signals of DRN GABA neurons.
Results from a VGAT-DRNGCaMP6m mouse (a) and the population data (b; n=8 mice) showing Ca2+ signals associated with sucrose lick. Each row in the upper panel of a represents one licking bout in a behaviour session. Thick lines indicate mean and shaded areas indicate s.e.m. Red and blue line segments in the plots represent significant increase and decrease of Ca2+ signals (P<0.05; permutation tests), respectively. The effect of food intake on the Ca2+ signals of DRN GABA neurons from a single mouse (c) and the entire test population (d; n=8 mice). The effect of random footshocks on Ca2+ signals in DRN GABA neurons from a single mouse (e) and the entire test population (f; n=8 mice).
Figure 8
Figure 8. The spike firing activity pattern of individual DRN GABA neurons during the foraging task.
(a) The activity pattern of a DRN GABA neuron from a VGAT-ChR2-EYFP mouse. Upper panel, spike firing rate aligned to the reward-zone-in events of each trial. Lower panel, the plots of neuronal firing rates and mouse lick rates across trials. Inset shows the waveform overlay of average spontaneous spikes (black) and average light-evoked spikes (blue). Thick lines indicate mean and shaded areas indicate s.e.m. Blue line segments in the plots represent significant decrease of Ca2+ signals (P<0.05; permutation tests). (b) Z-score representation of the activity patterns of individual GABA neurons (n=45 cells). Each row indicates one cell. Data were hierarchically clustered. The two dashed lines indicate reward-zone-in events and sucrose delivery. (c) Mean PETH of Z-scores for the 38 type-1 GABA neurons.

References

    1. Schultz W., Dayan P. & Montague P. R. A neural substrate of prediction and reward. Science 275, 1593–1599 (1997). - PubMed
    1. Wise R. A. Dopamine, learning and motivation. Nat. Rev. Neurosci. 5, 483–494 (2004). - PubMed
    1. Berridge K. C. The debate over dopamine's role in reward: the case for incentive salience. Psychopharmacology (Berl) 191, 391–431 (2007). - PubMed
    1. Cohen J. Y., Haesler S., Vong L., Lowell B. B. & Uchida N. Neuron-type-specific signals for reward and punishment in the ventral tegmental area. Nature 482, 85–88 (2012). - PMC - PubMed
    1. Jacobs B. L. & Azmitia E. C. Structure and function of the brain serotonin system. Physiol. Rev. 72, 165–229 (1992). - PubMed

Publication types

LinkOut - more resources