

Generalized logical model based on network topology to capture the dynamical trends of cellular signaling pathways
- PMID: 26818802
- PMCID: PMC4895646
- DOI: 10.1186/s12918-015-0249-9
Generalized logical model based on network topology to capture the dynamical trends of cellular signaling pathways
Abstract
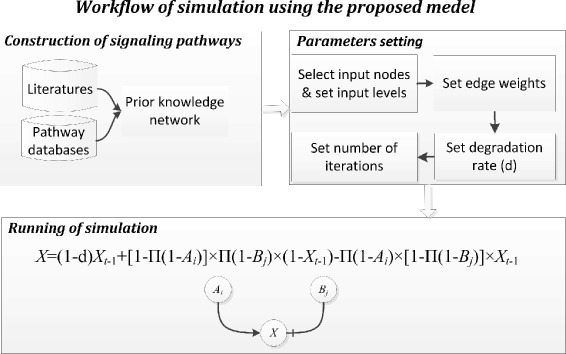
Background: Cellular responses to extracellular perturbations require signaling pathways to capture and transmit the signals. However, the underlying molecular mechanisms of signal transduction are not yet fully understood, thus detailed and comprehensive models may not be available for all the signaling pathways. In particular, insufficient knowledge of parameters, which is a long-standing hindrance for quantitative kinetic modeling necessitates the use of parameter-free methods for modeling and simulation to capture dynamic properties of signaling pathways.
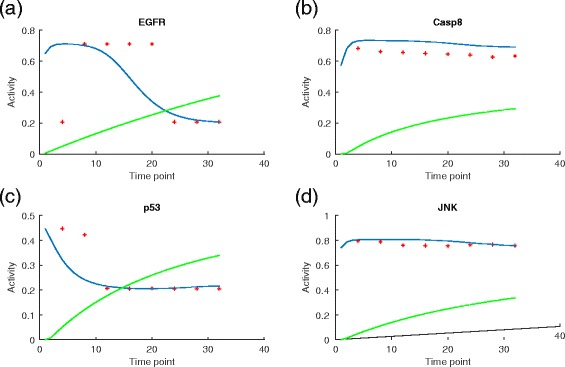
Results: We present a computational model that is able to simulate the graded responses to degradations, the sigmoidal biological relationships between signaling molecules and the effects of scheduled perturbations to the cells. The simulation results are validated using experimental data of protein phosphorylation, demonstrating that the proposed model is capable of capturing the main trend of protein activities during the process of signal transduction. Compared with existing simulators, our model has better performance on predicting the state transitions of signaling networks.
Conclusion: The proposed simulation tool provides a valuable resource for modeling cellular signaling pathways using a knowledge-based method.
Figures
Similar articles
-
Discovering dominant pathways and signal-response relationships in signaling networks through nonparametric approaches.Genomics. 2013 Oct;102(4):195-201. doi: 10.1016/j.ygeno.2013.07.012. Epub 2013 Aug 2. Genomics. 2013. PMID: 23912059
-
Power-Law Modeling of Cancer Cell Fates Driven by Signaling Data to Reveal Drug Effects.PLoS One. 2016 Oct 20;11(10):e0165049. doi: 10.1371/journal.pone.0165049. eCollection 2016. PLoS One. 2016. PMID: 27764199 Free PMC article.
-
The crosstalk between EGF, IGF, and Insulin cell signaling pathways--computational and experimental analysis.BMC Syst Biol. 2009 Sep 4;3:88. doi: 10.1186/1752-0509-3-88. BMC Syst Biol. 2009. PMID: 19732446 Free PMC article.
-
Methodologies for the modeling and simulation of biochemical networks, illustrated for signal transduction pathways: a primer.Biosystems. 2015 Mar;129:1-18. doi: 10.1016/j.biosystems.2015.01.008. Epub 2015 Jan 28. Biosystems. 2015. PMID: 25637875 Review.
-
Computational modeling of the main signaling pathways involved in mast cell activation.Curr Top Microbiol Immunol. 2014;382:69-93. doi: 10.1007/978-3-319-07911-0_4. Curr Top Microbiol Immunol. 2014. PMID: 25116096 Review.
Cited by
-
Sig2GRN: a software tool linking signaling pathway with gene regulatory network for dynamic simulation.BMC Syst Biol. 2016 Dec 23;10(Suppl 4):123. doi: 10.1186/s12918-016-0365-1. BMC Syst Biol. 2016. PMID: 28155685 Free PMC article.
-
Knowledge-guided fuzzy logic modeling to infer cellular signaling networks from proteomic data.Sci Rep. 2016 Oct 24;6:35652. doi: 10.1038/srep35652. Sci Rep. 2016. PMID: 27774993 Free PMC article.
References
Publication types
MeSH terms
Substances
Grants and funding
LinkOut - more resources
Full Text Sources
Other Literature Sources
