

Leaf Length Tracker: a novel approach to analyse leaf elongation close to the thermal limit of growth in the field
- PMID: 26818912
- PMCID: PMC4783369
- DOI: 10.1093/jxb/erw003
Leaf Length Tracker: a novel approach to analyse leaf elongation close to the thermal limit of growth in the field
Abstract
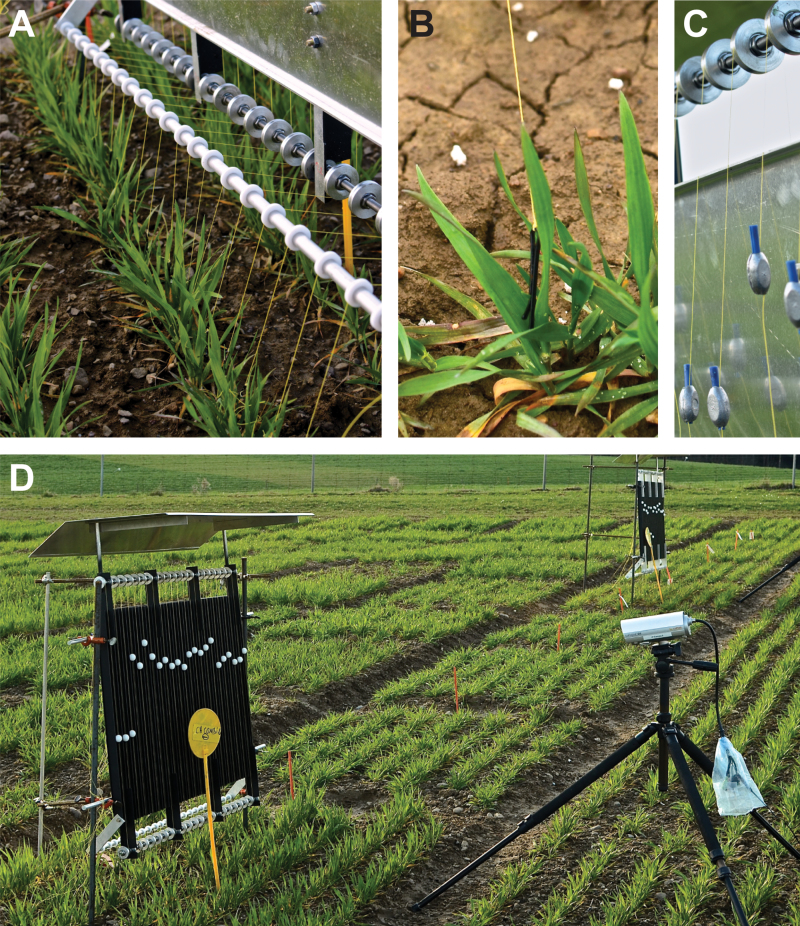
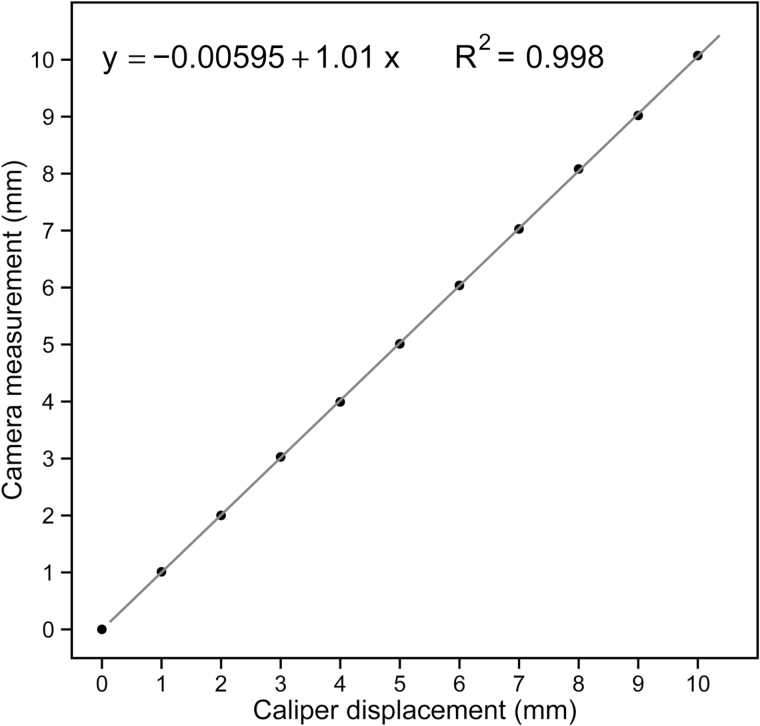
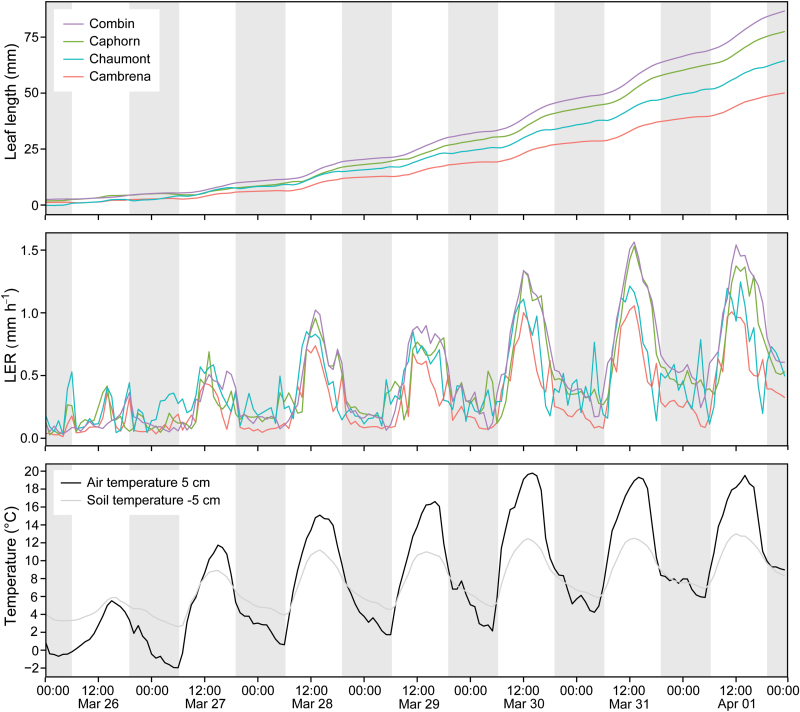
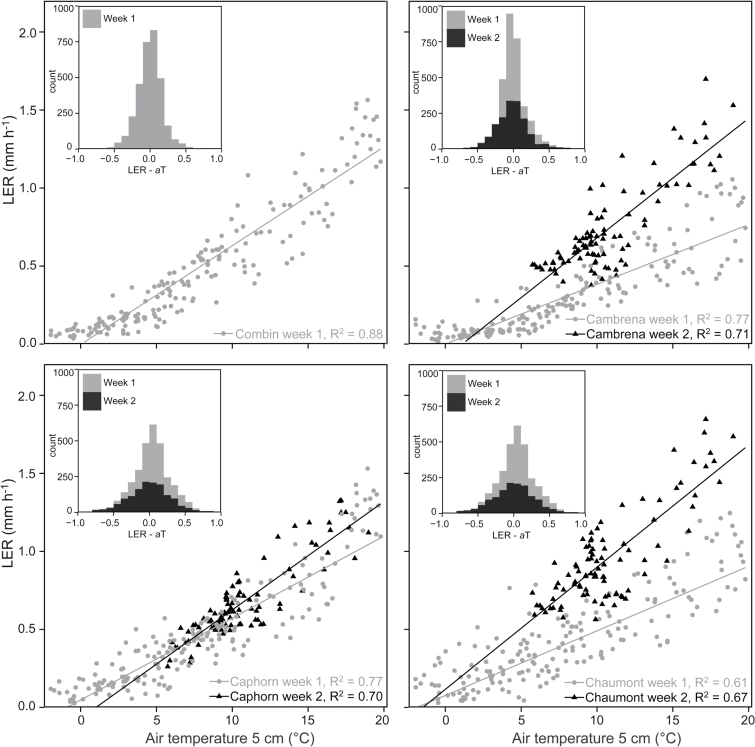
Leaf growth in monocot crops such as wheat and barley largely follows the daily temperature course, particularly under cold but humid springtime field conditions. Knowledge of the temperature response of leaf extension, particularly variations close to the thermal limit of growth, helps define physiological growth constraints and breeding-related genotypic differences among cultivars. Here, we present a novel method, called 'Leaf Length Tracker' (LLT), suitable for measuring leaf elongation rates (LERs) of cereals and other grasses with high precision and high temporal resolution under field conditions. The method is based on image sequence analysis, using a marker tracking approach to calculate LERs. We applied the LLT to several varieties of winter wheat (Triticum aestivum), summer barley (Hordeum vulgare), and ryegrass (Lolium perenne), grown in the field and in growth cabinets under controlled conditions. LLT is easy to use and we demonstrate its reliability and precision under changing weather conditions that include temperature, wind, and rain. We found that leaf growth stopped at a base temperature of 0°C for all studied species and we detected significant genotype-specific differences in LER with rising temperature. The data obtained were statistically robust and were reproducible in the tested environments. Using LLT, we were able to detect subtle differences (sub-millimeter) in leaf growth patterns. This method will allow the collection of leaf growth data in a wide range of future field experiments on different graminoid species or varieties under varying environmental or treatment conditions.
Keywords: Field conditions; leaf elongation; low temperature; marker tracking; monocotyledons; phenotyping; plant growth..
© The Author 2016. Published by Oxford University Press on behalf of the Society for Experimental Biology.
Figures
Similar articles
-
A comparative analysis of leaf shape of wheat, barley and maize using an empirical shape model.Ann Bot. 2011 Apr;107(5):865-73. doi: 10.1093/aob/mcq181. Epub 2010 Oct 7. Ann Bot. 2011. PMID: 20929895 Free PMC article.
-
A comparative analysis of the temperature response of leaf elongation in Bromus stamineus and Lolium perenne plants in the field: intrinsic and size-mediated effects.Ann Bot. 2007 Oct;100(4):813-20. doi: 10.1093/aob/mcm174. Epub 2007 Aug 23. Ann Bot. 2007. PMID: 17717025 Free PMC article.
-
High-throughput 3D modelling to dissect the genetic control of leaf elongation in barley (Hordeum vulgare).Plant J. 2019 May;98(3):555-570. doi: 10.1111/tpj.14225. Epub 2019 Feb 22. Plant J. 2019. PMID: 30604470 Free PMC article.
-
Senescence, nutrient remobilization, and yield in wheat and barley.J Exp Bot. 2014 Jul;65(14):3783-98. doi: 10.1093/jxb/ert477. Epub 2014 Jan 27. J Exp Bot. 2014. PMID: 24470467 Review.
-
Developmental pathways for shaping spike inflorescence architecture in barley and wheat.J Integr Plant Biol. 2019 Mar;61(3):278-295. doi: 10.1111/jipb.12771. J Integr Plant Biol. 2019. PMID: 30609316 Review.
Cited by
-
The Role of Low Soil Temperature for Photosynthesis and Stomatal Conductance of Three Graminoids From Different Elevations.Front Plant Sci. 2019 Mar 18;10:330. doi: 10.3389/fpls.2019.00330. eCollection 2019. Front Plant Sci. 2019. PMID: 30936890 Free PMC article.
-
Mathematical modeling of diurnal patterns of carbon allocation to shoot and root in Arabidopsis thaliana.NPJ Syst Biol Appl. 2019 Jan 24;5:4. doi: 10.1038/s41540-018-0080-1. eCollection 2019. NPJ Syst Biol Appl. 2019. PMID: 30701083 Free PMC article.
-
Wearable Sensor: An Emerging Data Collection Tool for Plant Phenotyping.Plant Phenomics. 2023 Jul 4;5:0051. doi: 10.34133/plantphenomics.0051. eCollection 2023. Plant Phenomics. 2023. PMID: 37408737 Free PMC article. Review.
-
Phenotyping a Dynamic Trait: Leaf Growth of Perennial Ryegrass Under Water Limiting Conditions.Front Plant Sci. 2019 Mar 22;10:344. doi: 10.3389/fpls.2019.00344. eCollection 2019. Front Plant Sci. 2019. PMID: 30967891 Free PMC article.
-
From Neglecting to Including Cultivar-Specific Per Se Temperature Responses: Extending the Concept of Thermal Time in Field Crops.Plant Phenomics. 2024 Jun 1;6:0185. doi: 10.34133/plantphenomics.0185. eCollection 2024. Plant Phenomics. 2024. PMID: 38827955 Free PMC article.
References
-
- Araus JL, Cairns JE. 2014. Field high-throughput phenotyping: the new crop breeding frontier. Trends in Plant Science 19, 52–61. - PubMed
-
- Bliss LC. 1956. A comparison of plant development in microenvironments of arctic and alpine tundras. Ecological Monographs 26, 303–337
-
- Blum A. 1986. The effect of heat stress on wheat leaf and ear photosynthesis. Journal of Experimental Botany 37, 111–118.
-
- Bovie WT. 1912. A precision auxanometer. Botanical Gazette 53, 504–509.
MeSH terms
LinkOut - more resources
Full Text Sources
Other Literature Sources
