Reduction in parvalbumin expression not loss of the parvalbumin-expressing GABA interneuron subpopulation in genetic parvalbumin and shank mouse models of autism
- PMID: 26819149
- PMCID: PMC4729132
- DOI: 10.1186/s13041-016-0192-8
Reduction in parvalbumin expression not loss of the parvalbumin-expressing GABA interneuron subpopulation in genetic parvalbumin and shank mouse models of autism
Abstract
Background: A reduction of the number of parvalbumin (PV)-immunoreactive (PV(+)) GABAergic interneurons or a decrease in PV immunoreactivity was reported in several mouse models of autism spectrum disorders (ASD). This includes Shank mutant mice, with SHANK being one of the most important gene families mutated in human ASD. Similar findings were obtained in heterozygous (PV+/-) mice for the Pvalb gene, which display a robust ASD-like phenotype. Here, we addressed the question whether the observed reduction in PV immunoreactivity was the result of a decrease in PV expression levels and/or loss of the PV-expressing GABA interneuron subpopulation hereafter called "Pvalb neurons". The two alternatives have important implications as they likely result in opposing effects on the excitation/inhibition balance, with decreased PV expression resulting in enhanced inhibition, but loss of the Pvalb neuron subpopulation in reduced inhibition.
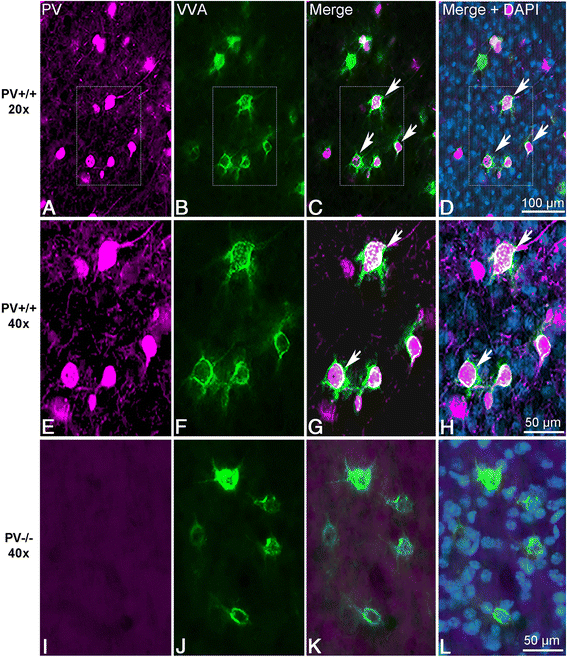
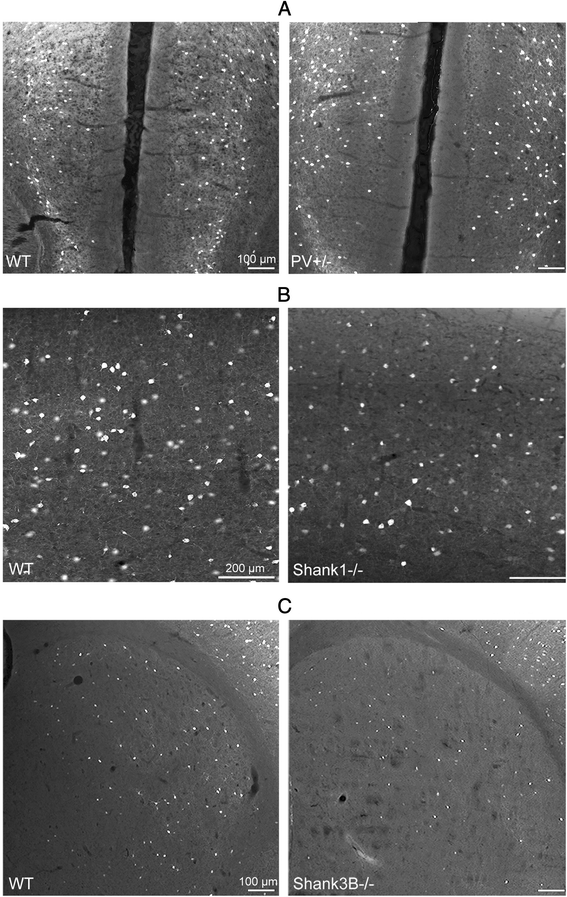
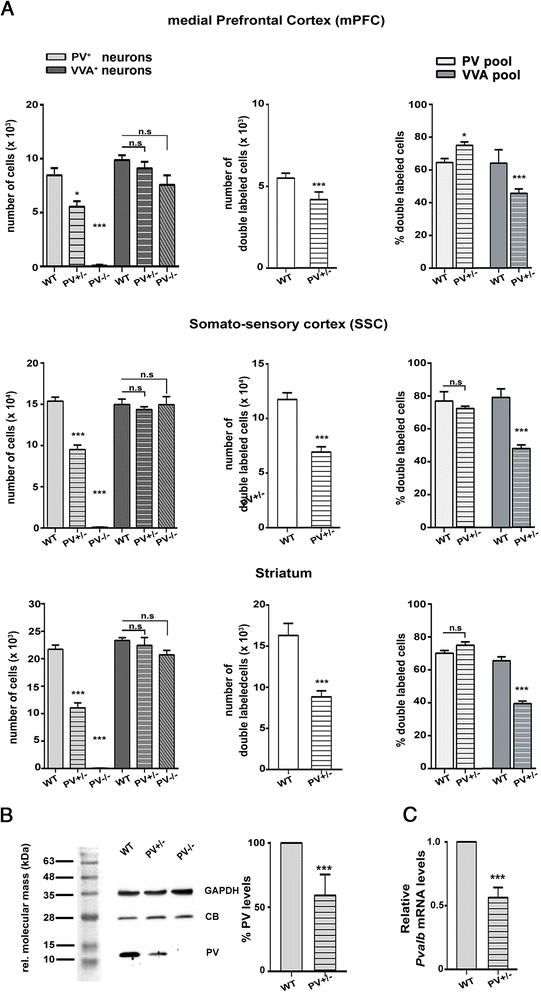
Methods: Stereology was used to determine the number of Pvalb neurons in ASD-associated brain regions including the medial prefrontal cortex, somatosensory cortex and striatum of PV-/-, PV+/-, Shank1-/- and Shank3B-/- mice. As a second marker for the identification of Pvalb neurons, we used Vicia Villosa Agglutinin (VVA), a lectin recognizing the specific extracellular matrix enwrapping Pvalb neurons. PV protein and Pvalb mRNA levels were determined quantitatively by Western blot analyses and qRT-PCR, respectively.
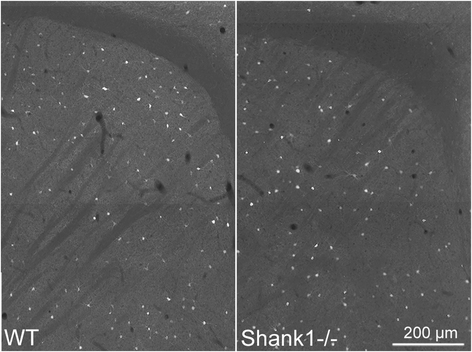
Results: Our analyses of total cell numbers in different brain regions indicated that the observed "reduction of PV(+) neurons" was in all cases, i.e., in PV+/-, Shank1-/- and Shank3B-/- mice, due to a reduction in Pvalb mRNA and PV protein, without any indication of neuronal cell decrease/loss of Pvalb neurons evidenced by the unaltered numbers of VVA(+) neurons.
Conclusions: Our findings suggest that the PV system might represent a convergent downstream endpoint for some forms of ASD, with the excitation/inhibition balance shifted towards enhanced inhibition due to the down-regulation of PV being a promising target for future pharmacological interventions. Testing whether approaches aimed at restoring normal PV protein expression levels and/or Pvalb neuron function might reverse ASD-relevant phenotypes in mice appears therefore warranted and may pave the way for novel therapeutic treatment strategies.
Figures


Similar articles
-
Prenatal Valproate Exposure Differentially Affects Parvalbumin-Expressing Neurons and Related Circuits in the Cortex and Striatum of Mice.Front Mol Neurosci. 2016 Dec 21;9:150. doi: 10.3389/fnmol.2016.00150. eCollection 2016. Front Mol Neurosci. 2016. PMID: 28066177 Free PMC article.
-
Absence of parvalbumin increases mitochondria volume and branching of dendrites in inhibitory Pvalb neurons in vivo: a point of convergence of autism spectrum disorder (ASD) risk gene phenotypes.Mol Autism. 2020 Jun 9;11(1):47. doi: 10.1186/s13229-020-00323-8. Mol Autism. 2020. PMID: 32517751 Free PMC article.
-
Dysregulation of Parvalbumin Expression in the Cntnap2-/- Mouse Model of Autism Spectrum Disorder.Front Mol Neurosci. 2018 Aug 2;11:262. doi: 10.3389/fnmol.2018.00262. eCollection 2018. Front Mol Neurosci. 2018. PMID: 30116174 Free PMC article.
-
The Role of Parvalbumin Interneurons in Autism Spectrum Disorder.J Neurosci Res. 2024 Oct;102(10):e25391. doi: 10.1002/jnr.25391. J Neurosci Res. 2024. PMID: 39400385 Review.
-
Prefrontal and Hippocampal Parvalbumin Interneurons in Animal Models for Schizophrenia: A Systematic Review and Meta-analysis.Schizophr Bull. 2024 Jan 1;50(1):210-223. doi: 10.1093/schbul/sbad123. Schizophr Bull. 2024. PMID: 37584417 Free PMC article.
Cited by
-
"Neural Noise" in Auditory Responses in Young Autistic and Neurotypical Children.J Autism Dev Disord. 2024 Feb;54(2):642-661. doi: 10.1007/s10803-022-05797-4. Epub 2022 Nov 25. J Autism Dev Disord. 2024. PMID: 36434480 Free PMC article.
-
Basic quantitative morphological methods applied to the central nervous system.J Comp Neurol. 2021 Mar;529(4):694-756. doi: 10.1002/cne.24976. Epub 2020 Aug 1. J Comp Neurol. 2021. PMID: 32639600 Free PMC article. Review.
-
Deletion of Fmr1 from Forebrain Excitatory Neurons Triggers Abnormal Cellular, EEG, and Behavioral Phenotypes in the Auditory Cortex of a Mouse Model of Fragile X Syndrome.Cereb Cortex. 2020 Mar 14;30(3):969-988. doi: 10.1093/cercor/bhz141. Cereb Cortex. 2020. PMID: 31364704 Free PMC article.
-
GABAergic System Dysfunction in Autism Spectrum Disorders.Front Cell Dev Biol. 2022 Feb 7;9:781327. doi: 10.3389/fcell.2021.781327. eCollection 2021. Front Cell Dev Biol. 2022. PMID: 35198562 Free PMC article. Review.
-
Dlx5/6 Expression Levels in Mouse GABAergic Neurons Regulate Adult Parvalbumin Neuronal Density and Anxiety/Compulsive Behaviours.Cells. 2022 May 25;11(11):1739. doi: 10.3390/cells11111739. Cells. 2022. PMID: 35681437 Free PMC article.
References
-
- Centers for Disease Control and Prevention Prevalence of autism spectrum disorder among children aged 8 years - autism and developmental disabilities monitoring network, 11 sites, United States, 2010. MMWR Surveill Summ. 2014;63(2):1–21. - PubMed
Publication types
MeSH terms
Substances
LinkOut - more resources
Full Text Sources
Other Literature Sources
Molecular Biology Databases
Research Materials
Miscellaneous

