. 2016 Jan 27:13:22.
doi: 10.1186/s12974-016-0487-9.

Type I Interferon response in olfactory bulb, the site of tick-borne flavivirus accumulation, is primarily regulated by IPS-1

Affiliations

Type I Interferon response in olfactory bulb, the site of tick-borne flavivirus accumulation, is primarily regulated by IPS-1

Chaitanya Kurhade et al. J Neuroinflammation. .

Abstract

Background: Although type I interferons (IFNs)-key effectors of antiviral innate immunity are known to be induced via different pattern recognition receptors (PRRs), the cellular source and the relative contribution of different PRRs in host protection against viral infection is often unclear. IPS-1 is a downstream adaptor for retinoid-inducible gene I (RIG-I)-like receptor signaling. In this study, we investigate the relative contribution of IPS-1 in the innate immune response in the different brain regions during infection with tick-borne encephalitis virus (TBEV), a flavivirus that causes a variety of severe symptoms like hemorrhagic fevers, encephalitis, and meningitis in the human host.

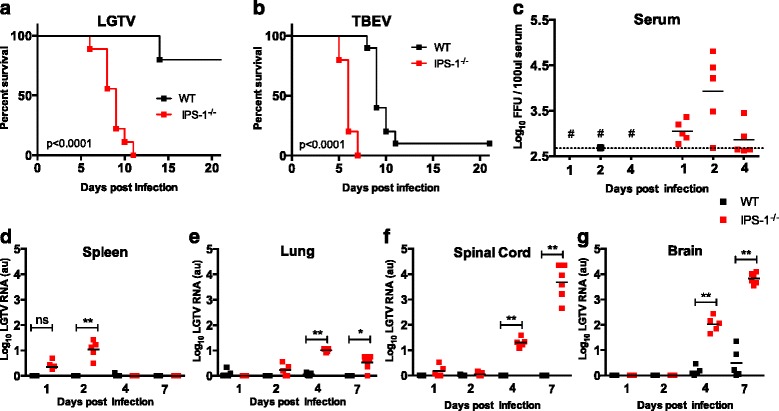
Methods: IPS-1 knockout mice were infected with TBEV/Langat virus (LGTV), and viral burden in the peripheral and the central nervous systems, type I IFN induction, brain infiltrating cells, and inflammatory response was analyzed.

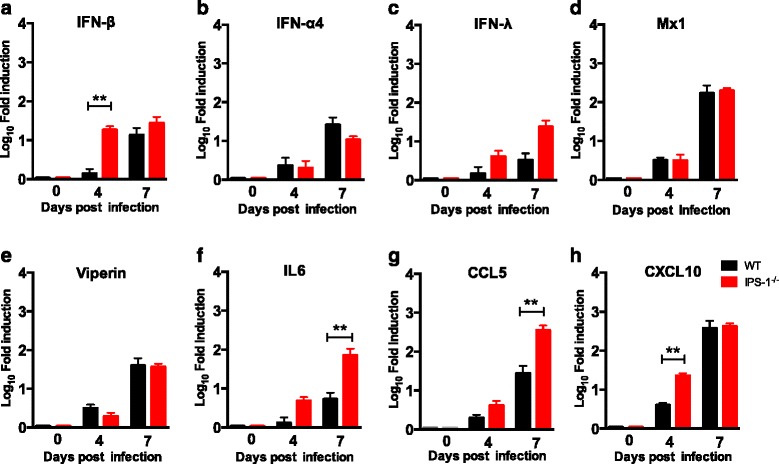
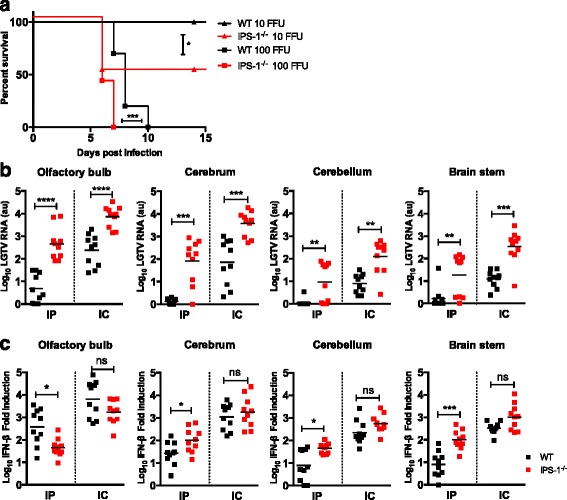
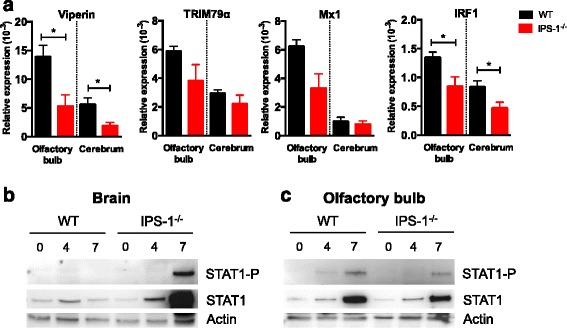
Results: We show that IPS-1 is indispensable for controlling TBEV and LGTV infections in the peripheral and central nervous system. Our data indicate that IPS-1 regulates neuropathogenicity in mice. IFN response is differentially regulated in distinct regions of the central nervous system (CNS) influencing viral tropism, as LGTV replication was mainly restricted to olfactory bulb in wild-type (WT) mice. In contrast to the other brain regions, IFN upregulation in the olfactory bulb was dependent on IPS-1 signaling. IPS-1 regulates basal levels of antiviral interferon-stimulated genes (ISGs) like viperin and IRF-1 which contributes to the establishment of early viral replication which inhibits STAT1 activation. This diminishes the antiviral response even in the presence of high IFN-β levels. Consequently, the absence of IPS-1 causes uncontrolled virus replication, in turn resulting in apoptosis, activation of microglia and astrocytes, elevated proinflammatory response, and recruitment of inflammatory cells into the CNS.

Conclusions: We show that LGTV replication is restricted to the olfactory bulb and that IPS-1 is a very important player in the olfactory bulb in shaping the innate immune response by inhibiting early viral replication and viral spread throughout the central nervous system. In the absence of IPS-1, higher viral replication leads to the evasion of antiviral response by inhibiting interferon signaling. Our data suggest that the local microenvironment of distinct brain regions is critical to determine virus permissiveness.


Figures

Fig. 1
Fig. 1
IPS-1 signaling controls LGTV replication in the CNS. a, b Survival of WT and IPS-1 −/− mice. Mice were inoculated with 104 FFU of LGTV (WT n = 10, IPS-1 −/− n = 10) or TBEV strain Hypr 71 (WT n = 10, IPS-1 −/− n = 5) via the intraperitoneal route and monitored for mortality for 21 days. Survival differences were tested for statistical significance by the log-rank test. c Viral burden in serum (n = 5). Serum were harvested various days post intraperitoneal infection of LGTV (104 FFU). Viral RNA in the serum was quantified by real-time RT-PCR detecting the LGTV NS3 and compared with a standard curve derived from control serum samples spiked with LGTV. Number sign means not detectable; dotted line represents the detection limit. dg Viral burden in different organs after intraperitoneal infection of LGTV (104 FFU, n = 5–6) measured by real-time qPCR detecting LGTV NS3 gene (detection limit 10 copies) and normalized to intracellular GAPDH levels. d Spleen. e Lung. f Spinal cord. g Brain. Asterisks indicate statistical significance calculated by Mann-Whitney test, **p < 0.01, *p < 0.05. au arbitrary units
Fig. 2
Fig. 2
Impact of IPS signaling on chemokine, cytokine, and ISG expression upon virus infection. WT and IPS-1 −/− mice were infected intraperitoneally with 104 FFU of LGTV, and the brains were harvested on 0, 4, and 7 dpi. Expression levels of IFN-β, IFN-α4, IFN-λ, Mx1, viperin, IL6, CCL5, and CXCL10 were determined by real-time RT-PCR (ah). Data represent the mean and standard error of the mean (SEM) of five to six mice per time point from at least two independent experiments. Asterisks indicates statistical significance calculated by Mann-Whitney test, **p < 0.01
Fig. 3
Fig. 3
Increased CNS infiltration in the absence of IPS-1 signaling. WT and IPS-1 −/− mice were infected intraperitoneally with 104 FFU of LGTV. Leukocytes were isolated from the brains at different time points 0, 4, and 7 dpi by Percoll gradient centrifugation, stained for various cell markers, and analyzed by flow cytometry. a The total number of brain lymphocytes was determined by cell counting. b The total number of CD4+ T cells. c The total number of CD8+cells. d The total number of dendritic (CD11c+) cells. e The total number of infiltrating macrophages and neutrophils (CD45hiCD11b+). f The total number of microglia (CD45lowCD11b+). g Representative flow cytometry diagram of CD45 and CD11b staining of brain leukocytes from WT and IPS-1 −/− mice. Data represent the mean and standard error of the mean (SEM) of 3–10 mice per time point from at least two independent experiments. h WT and IPS-1 −/− mice were infected intraperitoneally with 104 FFU of LGTV, and mice brains were isolated for immunohistology (n = 5). Depicted are the immunohistological analyses of the olfactory bulb of uninfected and infected mice (7 dpi). Caspase 3 (red) and DAPI (blue). Magnification ×40, scale bar 50 μm. i Quantification of Caspase 3 (Asp175+)-positive cells in the olfactory bulb of uninfected and infected mice (7 dpi). Asterisks indicates statistical significance calculated by Mann-Whitney test, ****p < 0.0001, ***p < 0.001, **p < 0.01, *p < 0.05. ns not significant
Fig. 4
Fig. 4
IPS-1 is important for controlling infection in the CNS. WT and IPS-1 −/− mice were infected intraperitoneally with 104 FFU of LGTV, and mice brains were isolated for immunohistology. a Depicted are the immunohistological analyses of the glomerular layer of the olfactory bulb and hippocampus of uninfected and infected mice (7 dpi). Representative pictures of at least two mice per group, GFAP (red), LGTV E-protein (green), and DAPI (blue). Magnification ×10, scale bar 200 μm. b Depicted are the immunohistological analyses of the glomerular layer of the olfactory bulb in uninfected and infected mice (7 dpi). Representative pictures of at least two mice per group, GFAP or IBA-1 or NeuN (red), LGTV E-protein (green), and DAPI (blue). Virus-infected astrocytes, microglial cell, and neurons are indicated by a white arrow. Magnification ×40, scale bar 50 μm. c Quantification of LGTV positive GFAP, IBA-1, and NeuN-positive cells in glomerular layer of the olfactory bulb in infected mice (7 dpi). d Primary neurons isolated from hippocampus of WT and IPS-1 −/− were infected with 0.001 MOI of LGTV; viral burden were analyzed by focus forming assay 24, 48, and 72 h post infection. Data represent the mean and standard error of the mean (SEM) of from at least three independent experiments. Asterisks indicate statistical significance calculated by unpaired T test * p < 0.05
Fig. 5
Fig. 5
IPS-1 signaling controls local antiviral response within CNS. a Survival analysis of WT and IPS-1 −/− mice. Mice (n = 9–10) were inoculated with 10 or 100 FFU of LGTV via the intracranial route and monitored for mortality for 21 days. Survival differences were tested for statistical significance by the log-rank test, * p < 0.05. bc WT and IPS-1 −/− mice were infected with LGTV intraperitoneally (104 FFU) or intracranially (102 FFU) and different regions of the brain, olfactory bulb, cerebrum, cerebellum and brain stem, were harvested 7 dpi and 5 dpi, respectively. Viral burden (b) were quantitated by real-time qPCR detecting the 3′ NCR (detection limit 104 copies) n = 10 per experiment. IFN-β fold induction (c) after infection was calculated by measuring IFN-β levels in uninfected and infected brain parts by real-time RT-PCR, setting the IFN-β level in uninfected control samples to one and calculate the fold induction of IFN-β RNA transcript from infected brain parts. Asterisks indicates statistical significance calculated by Mann-Whitney test, ****p < 0.0001, ***p < 0.001, **p < 0.01, *p < 0.05. ns not significant, au arbitrary units
Fig. 6
Fig. 6
IPS-1 −/− mice show lower basal expression of antiviral ISGs and a delayed STAT1 phosphorylation in the olfactory bulb after LGTV infection. a Basal expression level of viperin, TRIM79α, Mx1, and IRF1 were determined by real-time RT-PCR for the olfactory bulb and cerebrum of uninfected WT and IPS-1 -/- mice. The data is displayed as relative expression levels values compared to the basal level of GAPDH. Data represent the mean and standard error of the mean (SEM) of five mice. Asterisks indicates statistical significance calculated by Mann-Whitney test, *p < 0.05. WT and IPS-1 −/− mice were infected with LGTV intraperitoneally (104 FFU), and whole brain (b) and olfactory bulb (c) were dissected out 0, 4, and 7 dpi and protein analysis of the STAT1-P, STAT1, and actin was measured by Western blot. Representative pictures are shown (n = 2)

Similar articles

Cited by

References

    1. Muller U, Steinhoff U, Reis LF, Hemmi S, Pavlovic J, Zinkernagel RM, et al. Functional role of type I and type II interferons in antiviral defense. Science. 1994;264(5167):1918–21. doi: 10.1126/science.8009221. - DOI - PubMed
    1. Diamond MS, Roberts TG, Edgil D, Lu B, Ernst J, Harris E. Modulation of dengue virus infection in human cells by alpha, beta, and gamma interferons. J Virol. 2000;74(11):4957–66. doi: 10.1128/JVI.74.11.4957-4966.2000. - DOI - PMC - PubMed
    1. Leyssen P, Drosten C, Paning M, Charlier N, Paeshuyse J, De Clercq E, et al. Interferons, interferon inducers, and interferon-ribavirin in treatment of flavivirus-induced encephalitis in mice. Antimicrob Agents Chemother. 2003;47(2):777–82. doi: 10.1128/AAC.47.2.777-782.2003. - DOI - PMC - PubMed
    1. Lobigs M, Mullbacher A, Wang Y, Pavy M, Lee E. Role of type I and type II interferon responses in recovery from infection with an encephalitic flavivirus. J Gen Virol. 2003;84(Pt 3):567–72. doi: 10.1099/vir.0.18654-0. - DOI - PubMed
    1. Samuel MA, Diamond MS. Alpha/beta interferon protects against lethal West Nile virus infection by restricting cellular tropism and enhancing neuronal survival. J Virol. 2005;79(21):13350–61. doi: 10.1128/JVI.79.21.13350-13361.2005. - DOI - PMC - PubMed

MeSH terms