

Cancer Incidence in Appalachia, 2004-2011
- PMID: 26819264
- PMCID: PMC6317710
- DOI: 10.1158/1055-9965.EPI-15-0946
Cancer Incidence in Appalachia, 2004-2011
Abstract
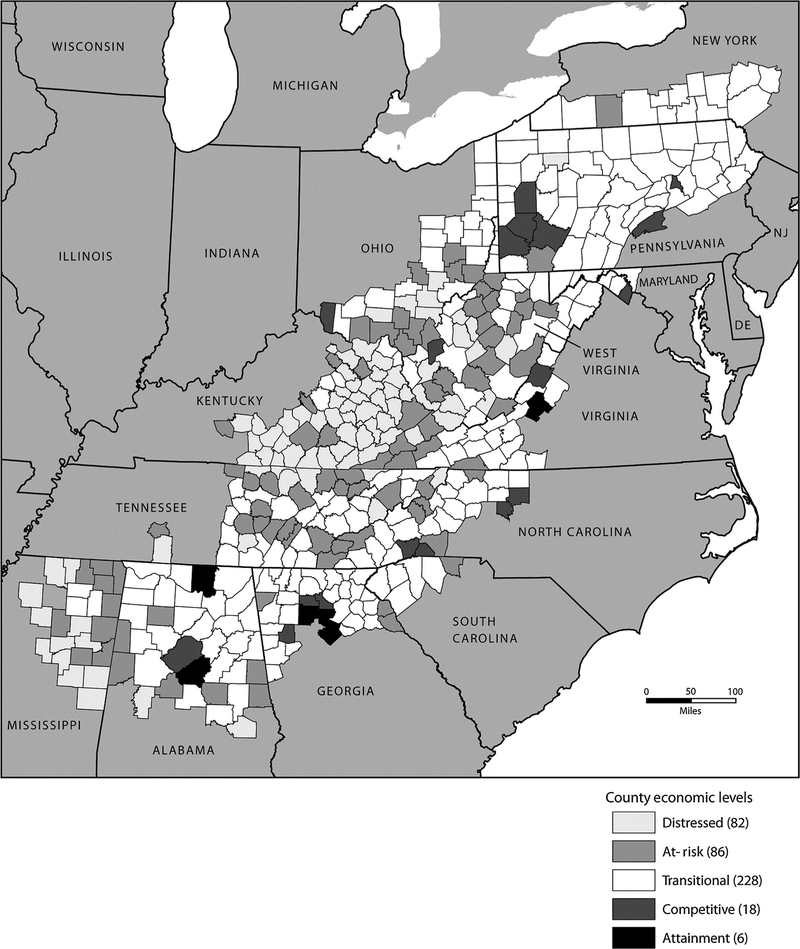
Background: Limited literature is available about cancer in the Appalachian Region. This is the only known analysis of all cancers for Appalachia and non-Appalachia covering 100% of the US population. Appalachian cancer incidence and trends were evaluated by state, sex, and race and compared with those found in non-Appalachian regions.
Methods: US counties were identified as Appalachian or non-Appalachian. Age-adjusted cancer incidence rates, standard errors, and confidence intervals were calculated using the most recent data from the United States Cancer Statistics for 2004 to 2011.
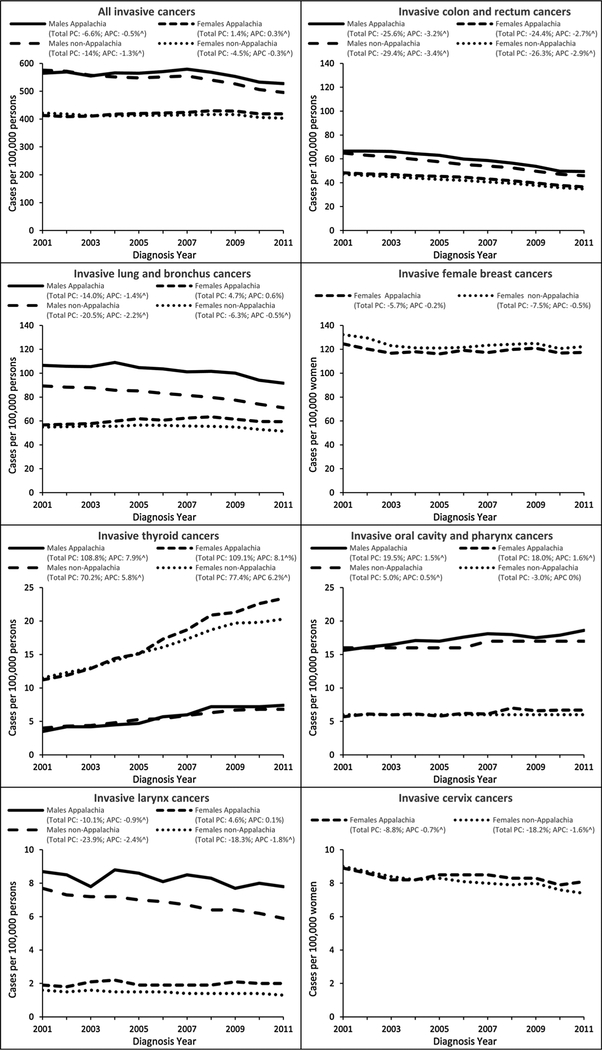
Results: Generally, Appalachia carries a higher cancer burden compared with non-Appalachia, particularly for tobacco-related cancers. For all cancer sites combined, Appalachia has higher rates regardless of sex, race, or region. The Appalachia and non-Appalachia cancer incidence gap has narrowed, with the exception of oral cavity and pharynx, larynx, lung and bronchus, and thyroid cancers.
Conclusions: Higher cancer incidence continues in Appalachia and appears at least in part to reflect high tobacco use and potential differences in socioeconomic status, other risk factors, patient health care utilization, or provider practices. It is important to continue to evaluate this population to monitor results from screening and early detection programs, understand behavioral risk factors related to cancer incidence, increase efforts to reduce tobacco use and increase cancer screening, and identify other areas where effective interventions may mediate disparities.
Impact: Surveillance and evaluation of special populations provide means to monitor screening and early detection programs, understand behavioral risk factors, and increase efforts to reduce tobacco use to mediate disparities.
©2016 American Association for Cancer Research.
Conflict of interest statement
Disclosure of Potential Conflicts of Interest
No potential conflicts of interest were disclosed.
Figures
References
-
- Appalachian Regional Commission [Internet]. Washington, DC: Available from: http://www.arc.gov/index.asp.
-
- Surveillance, Epidemiology, and End Results (SEER) Program (www.seer.cancer.gov) SEER*Stat Database: Populations - Total U.S. (1969–2012) <Katrina/Rita Adjustment> - Linked To County Attributes - Total U.S., 1969–2012 Counties, National Cancer Institute, DCCPS, Surveillance Research Program, Surveillance Systems Branch, released December 2013.
-
- SEER*Stat Database: NPCR and SEER Incidence - Analytic file - 1998–2011 - jbk 082714 - Linked To County Attributes - Total U.S., 1969–2012 Counties.
-
- County-Level Data Sets: Poverty. USDA Economic Research Service. Source: Bureau of the Census, Small Area Income and Poverty Estimates [cited 2013 Nov. 7]. Available from: http://ers.usda.gov/data-products/county-level-data-sets/poverty.aspx.
Publication types
MeSH terms
Grants and funding
LinkOut - more resources
Full Text Sources
Other Literature Sources
Miscellaneous
