

Role of Increased n-acetylaspartate Levels in Cancer
- PMID: 26819345
- PMCID: PMC4849357
- DOI: 10.1093/jnci/djv426
Role of Increased n-acetylaspartate Levels in Cancer
Abstract
Background: The clinical and biological effects of metabolic alterations in cancer are not fully understood.
Methods: In high-grade serous ovarian cancer (HGSOC) samples (n = 101), over 170 metabolites were profiled and compared with normal ovarian tissues (n = 15). To determine NAT8L gene expression across different cancer types, we analyzed the RNA expression of cancer types using RNASeqV2 data available from the open access The Cancer Genome Atlas (TCGA) website (http://www.cbioportal.org/public-portal/). Using NAT8L siRNA, molecular techniques and histological analysis, we determined cancer cell viability, proliferation, apoptosis, and tumor growth in in vitro and in vivo (n = 6-10 mice/group) settings. Data were analyzed with the Student's t test and Kaplan-Meier analysis. Statistical tests were two-sided.
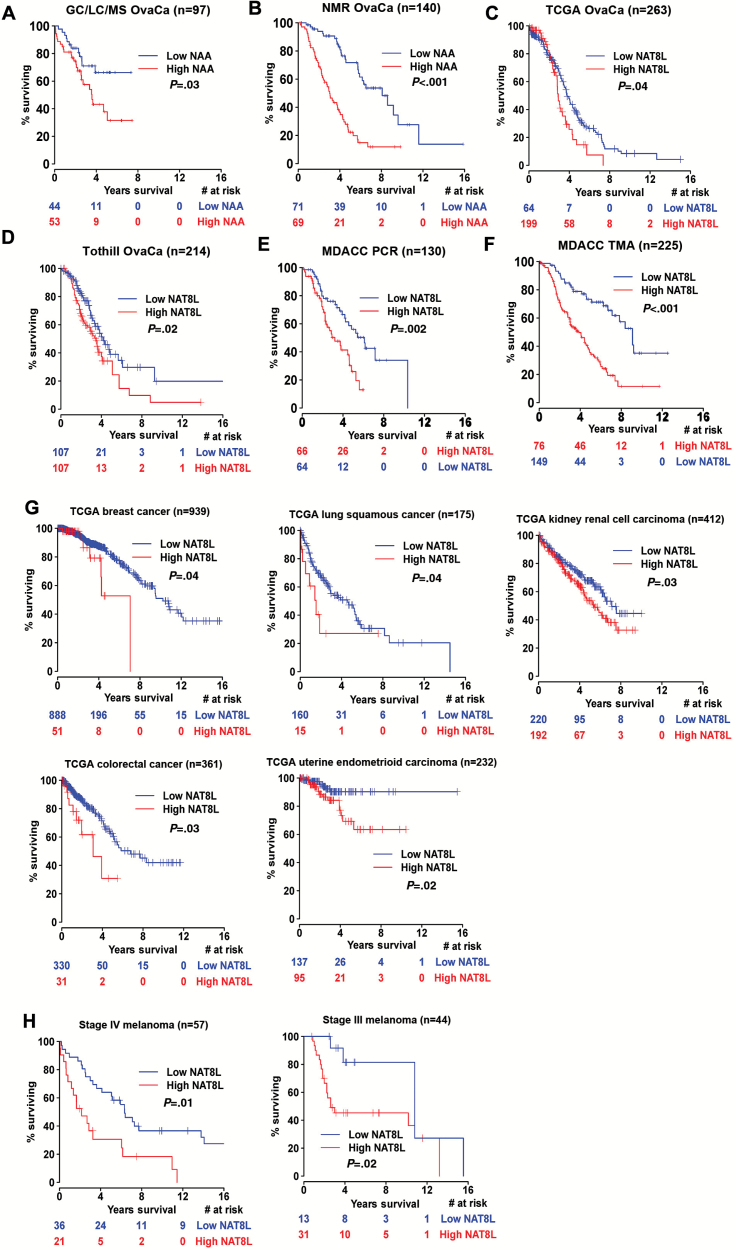
Results: Patients with high levels of tumoral NAA and its biosynthetic enzyme, aspartate N-acetyltransferase (NAT8L), had worse overall survival than patients with low levels of NAA and NAT8L. The overall survival duration of patients with higher-than-median NAA levels (3.6 years) was lower than that of patients with lower-than-median NAA levels (5.1 years, P = .03). High NAT8L gene expression in other cancers (melanoma, renal cell, breast, colon, and uterine cancers) was associated with worse overall survival. NAT8L silencing reduced cancer cell viability (HEYA8: control siRNA 90.61% ± 2.53, NAT8L siRNA 39.43% ± 3.00, P < .001; A2780: control siRNA 90.59% ± 2.53, NAT8L siRNA 7.44% ± 1.71, P < .001) and proliferation (HEYA8: control siRNA 74.83% ± 0.92, NAT8L siRNA 55.70% ± 1.54, P < .001; A2780: control siRNA 50.17% ± 4.13, NAT8L siRNA 26.52% ± 3.70, P < .001), which was rescued by addition of NAA. In orthotopic mouse models (ovarian cancer and melanoma), NAT8L silencing reduced tumor growth statistically significantly (A2780: control siRNA 0.52 g ± 0.15, NAT8L siRNA 0.08 g ± 0.17, P < .001; HEYA8: control siRNA 0.79 g ± 0.42, NAT8L siRNA 0.24 g ± 0.18, P = .008, A375-SM: control siRNA 0.55 g ± 0.22, NAT8L siRNA 0.21 g ± 0.17 g, P = .001). NAT8L silencing downregulated the anti-apoptotic pathway, which was mediated through FOXM1.
Conclusion: These findings indicate that the NAA pathway has a prominent role in promoting tumor growth and represents a valuable target for anticancer therapy.Altered energy metabolism is a hallmark of cancer (1). Proliferating cancer cells have much greater metabolic requirements than nonproliferating differentiated cells (2,3). Moreover, altered cancer metabolism elevates unique metabolic intermediates, which can promote cancer survival and progression (4,5). Furthermore, emerging evidence suggests that proliferating cancer cells exploit alternative metabolic pathways to meet their high demand for energy and to accumulate biomass (6-8).
© The Author 2016. Published by Oxford University Press. All rights reserved. For Permissions, please e-mail: journals.permissions@oup.com.
Figures


Similar articles
-
Cancer-Specific Production of N-Acetylaspartate via NAT8L Overexpression in Non-Small Cell Lung Cancer and Its Potential as a Circulating Biomarker.Cancer Prev Res (Phila). 2016 Jan;9(1):43-52. doi: 10.1158/1940-6207.CAPR-14-0287. Epub 2015 Oct 28. Cancer Prev Res (Phila). 2016. PMID: 26511490 Free PMC article.
-
N-acetylaspartate availability is essential for juvenile survival on fat-free diet and determines metabolic health.FASEB J. 2019 Dec;33(12):13808-13824. doi: 10.1096/fj.201801323R. Epub 2019 Nov 1. FASEB J. 2019. PMID: 31638418 Free PMC article.
-
Hindering NAT8L expression in hepatocellular carcinoma increases cytosolic aspartate delivery that fosters pentose phosphate pathway and purine biosynthesis promoting cell proliferation.Redox Biol. 2023 Feb;59:102585. doi: 10.1016/j.redox.2022.102585. Epub 2022 Dec 24. Redox Biol. 2023. PMID: 36580805 Free PMC article.
-
N-Acetylaspartate Metabolism Outside the Brain: Lipogenesis, Histone Acetylation, and Cancer.Front Endocrinol (Lausanne). 2017 Sep 20;8:240. doi: 10.3389/fendo.2017.00240. eCollection 2017. Front Endocrinol (Lausanne). 2017. PMID: 28979238 Free PMC article. Review.
-
Shati/Nat8l and N-acetylaspartate (NAA) Have Important Roles in Regulating Nicotinic Acetylcholine Receptors in Neuronal and Psychiatric Diseases in Animal Models and Humans.2018 Apr 4. In: Akaike A, Shimohama S, Misu Y, editors. Nicotinic Acetylcholine Receptor Signaling in Neuroprotection [Internet]. Singapore: Springer; 2018. Chapter 6. 2018 Apr 4. In: Akaike A, Shimohama S, Misu Y, editors. Nicotinic Acetylcholine Receptor Signaling in Neuroprotection [Internet]. Singapore: Springer; 2018. Chapter 6. PMID: 31314412 Free Books & Documents. Review.
Cited by
-
Metabolic Profiling of Formalin-Fixed Paraffin-Embedded Tissues Discriminates Normal Colon from Colorectal Cancer.Mol Cancer Res. 2020 Jun;18(6):883-890. doi: 10.1158/1541-7786.MCR-19-1091. Epub 2020 Mar 12. Mol Cancer Res. 2020. PMID: 32165453 Free PMC article.
-
Causality Between Immune Cells, Metabolites and Breast Cancer: Mendelian Randomization and Mediation Analysis.Biochem Genet. 2024 Nov 8. doi: 10.1007/s10528-024-10966-4. Online ahead of print. Biochem Genet. 2024. PMID: 39514081
-
Bridging the gap between non-targeted stable isotope labeling and metabolic flux analysis.Cancer Metab. 2016 Apr 23;4:10. doi: 10.1186/s40170-016-0150-z. eCollection 2016. Cancer Metab. 2016. PMID: 27110360 Free PMC article.
-
Evaluation of mitochondrial biogenesis and ROS generation in high-grade serous ovarian cancer.Front Oncol. 2023 Mar 1;13:1129352. doi: 10.3389/fonc.2023.1129352. eCollection 2023. Front Oncol. 2023. PMID: 36937395 Free PMC article.
-
Causal effects of genetically determined metabolites on cancers included lung, breast, ovarian cancer, and glioma: a Mendelian randomization study.Transl Lung Cancer Res. 2022 Jul;11(7):1302-1314. doi: 10.21037/tlcr-22-34. Transl Lung Cancer Res. 2022. PMID: 35958335 Free PMC article.
References
-
- Hanahan D, Weinberg RA. Hallmarks of cancer: the next generation. Cell. 2011;144(5):646–674. - PubMed
-
- Warburg O. On the origin of cancer cells. Science. 1956;123(3191):309–314. - PubMed
-
- DeBerardinis RJ, Lum JJ, Hatzivassiliou G, Thompson CB. The biology of cancer: metabolic reprogramming fuels cell growth and proliferation. Cell Metabolism. 2008;7(1):11–20. - PubMed
Publication types
MeSH terms
Substances
Grants and funding
LinkOut - more resources
Full Text Sources
Other Literature Sources
Medical
Molecular Biology Databases
Miscellaneous
