

The prediction accuracy of dynamic mixed-effects models in clustered data
- PMID: 26819631
- PMCID: PMC4728760
- DOI: 10.1186/s13040-016-0084-6
The prediction accuracy of dynamic mixed-effects models in clustered data
Abstract
Background: Clinical prediction models often fail to generalize in the context of clustered data, because most models fail to account for heterogeneity in outcome values and covariate effects across clusters. Furthermore, standard approaches for modeling clustered data, including generalized linear mixed-effects models, would not be expected to provide accurate predictions in novel clusters, because such predictions are typically based on the hypothetical mean cluster. We hypothesized that dynamic mixed-effects models, which incorporate data from previous predictions to refine the model for future predictions, would allow for cluster-specific predictions in novel clusters as the model is updated over time, thus improving overall model generalizability.
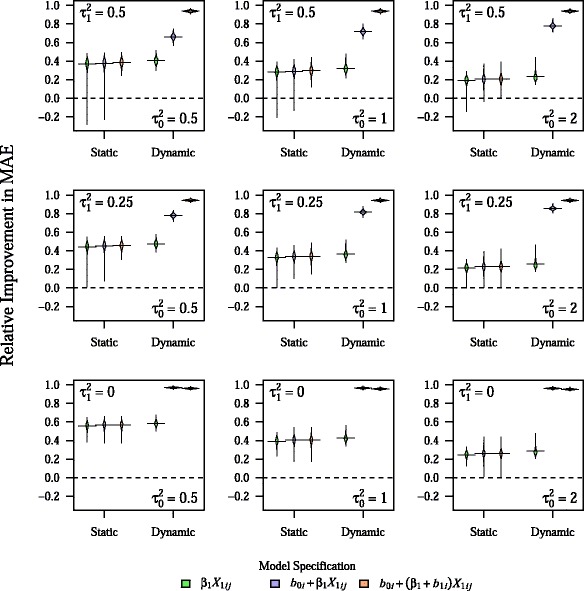
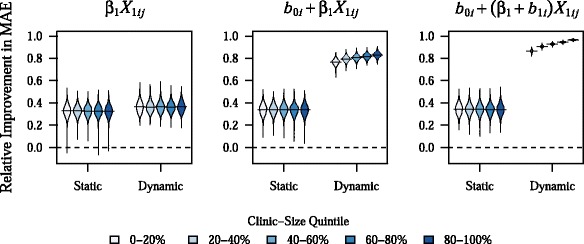
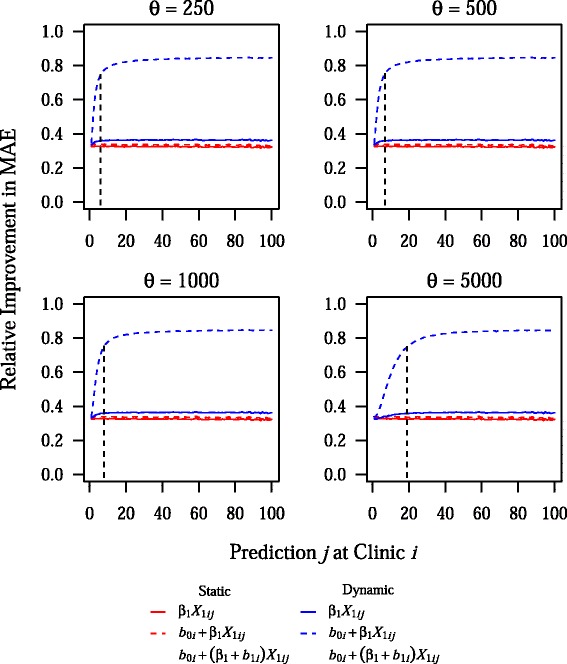
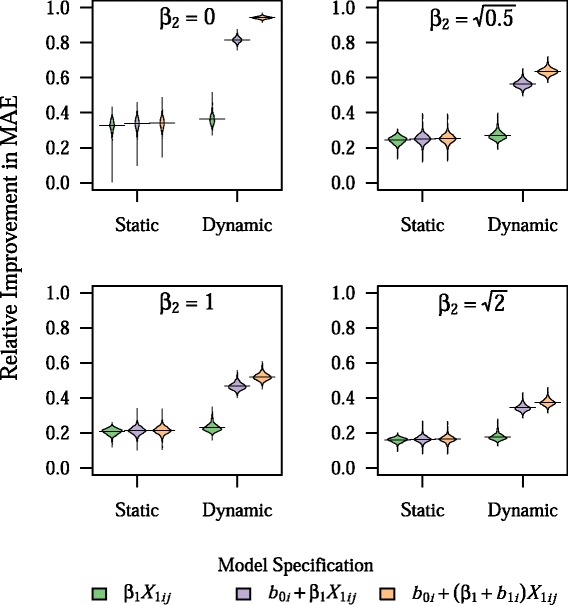
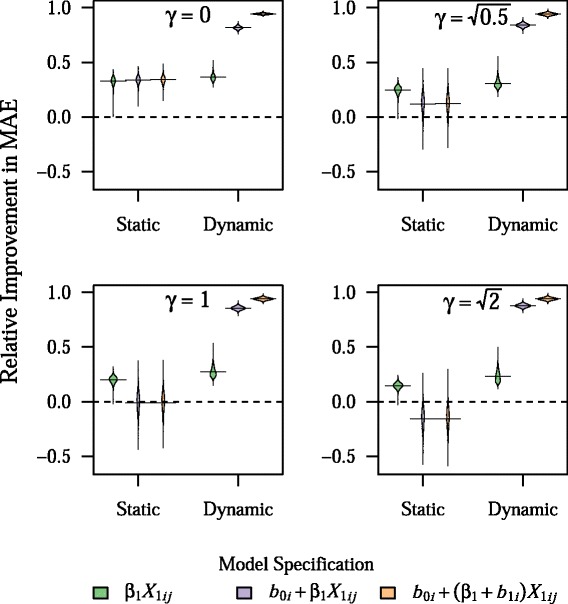
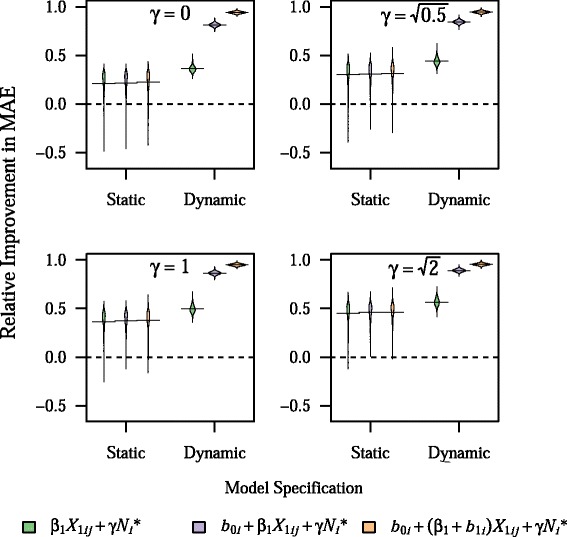
Results: We quantified the potential gains in prediction accuracy from using a dynamic modeling strategy in a simulation study. Furthermore, because clinical prediction models in the context of clustered data often involve outcomes that are dependent on patient volume, we examined whether using dynamic mixed-effects models would be robust to misspecification of the volume-outcome relationship. Our results indicated that dynamic mixed-effects models led to substantial improvements in prediction accuracy in clustered populations over a broad range of conditions, and were uniformly superior to static models. In addition, dynamic mixed-effects models were particularly robust to misspecification of the volume-outcome relationship and to variation in the frequency of model updating. The extent of the improvement in prediction accuracy that was observed with dynamic mixed-effects models depended on the relative impact of fixed and random effects on the outcome as well as the degree of misspecification of model fixed effects.
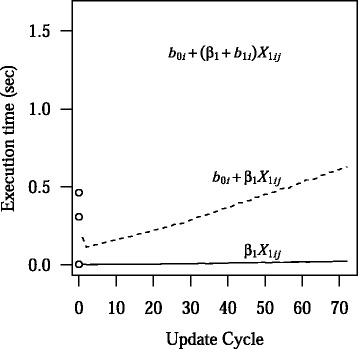
Conclusions: Dynamic mixed-effects models led to substantial improvements in prediction model accuracy across a broad range of simulated conditions. Therefore, dynamic mixed-effects models could be a useful alternative to standard static models for improving the generalizability of clinical prediction models in the setting of clustered data, and, thus, well worth the logistical challenges that may accompany their implementation in practice.
Keywords: Bayesian statistics; Clustered data; Dynamic modeling; Generalizability; Mixed-effects models; Prediction.
Figures
Similar articles
-
Prediction models for clustered data with informative priors for the random effects: a simulation study.BMC Med Res Methodol. 2018 Aug 6;18(1):83. doi: 10.1186/s12874-018-0543-5. BMC Med Res Methodol. 2018. PMID: 30081875 Free PMC article.
-
Risk prediction in multicentre studies when there is confounding by cluster or informative cluster size.BMC Med Res Methodol. 2021 Jul 4;21(1):135. doi: 10.1186/s12874-021-01321-x. BMC Med Res Methodol. 2021. PMID: 34218793 Free PMC article.
-
The effect of misspecification of random effects distributions in clustered data settings with outcome-dependent sampling.Can J Stat. 2011 Sep 1;39(3):488-497. doi: 10.1002/cjs.10117. Epub 2011 Jul 27. Can J Stat. 2011. PMID: 23204632 Free PMC article.
-
A Tutorial on Evaluating the Time-Varying Discrimination Accuracy of Survival Models Used in Dynamic Decision Making.Med Decis Making. 2018 Nov;38(8):904-916. doi: 10.1177/0272989X18801312. Epub 2018 Oct 14. Med Decis Making. 2018. PMID: 30319014 Free PMC article. Review.
-
Dynamic models to predict health outcomes: current status and methodological challenges.Diagn Progn Res. 2018 Dec 18;2:23. doi: 10.1186/s41512-018-0045-2. eCollection 2018. Diagn Progn Res. 2018. PMID: 31093570 Free PMC article. Review.
Cited by
-
A Comparison of Methods to Detect Changes in Prediction Models.Methods Inf Med. 2022 May;61(1-02):19-28. doi: 10.1055/s-0042-1742672. Epub 2022 Feb 12. Methods Inf Med. 2022. PMID: 35151231 Free PMC article.
-
Multi-task deep autoencoder to predict Alzheimer's disease progression using temporal DNA methylation data in peripheral blood.Comput Struct Biotechnol J. 2022 Oct 23;20:5761-5774. doi: 10.1016/j.csbj.2022.10.016. eCollection 2022. Comput Struct Biotechnol J. 2022. PMID: 36756173 Free PMC article.
-
Prediction models for clustered data with informative priors for the random effects: a simulation study.BMC Med Res Methodol. 2018 Aug 6;18(1):83. doi: 10.1186/s12874-018-0543-5. BMC Med Res Methodol. 2018. PMID: 30081875 Free PMC article.
-
Predicting prolonged dose titration in patients starting warfarin.Pharmacoepidemiol Drug Saf. 2016 Nov;25(11):1228-1235. doi: 10.1002/pds.4069. Epub 2016 Jul 26. Pharmacoepidemiol Drug Saf. 2016. PMID: 27456080 Free PMC article.
-
Developing more generalizable prediction models from pooled studies and large clustered data sets.Stat Med. 2021 Jul 10;40(15):3533-3559. doi: 10.1002/sim.8981. Epub 2021 May 5. Stat Med. 2021. PMID: 33948970 Free PMC article.
References
Grants and funding
LinkOut - more resources
Full Text Sources
Other Literature Sources
