

Characterization of Mycolic Acids in Total Fatty Acid Methyl Ester Fractions from Mycobacterium Species by High Resolution MALDI-TOFMS
- PMID: 26819906
- PMCID: PMC4541030
- DOI: 10.5702/massspectrometry.A0035
Characterization of Mycolic Acids in Total Fatty Acid Methyl Ester Fractions from Mycobacterium Species by High Resolution MALDI-TOFMS
Abstract
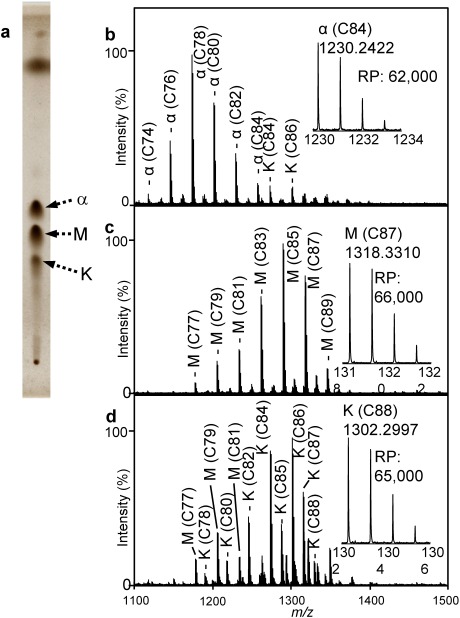
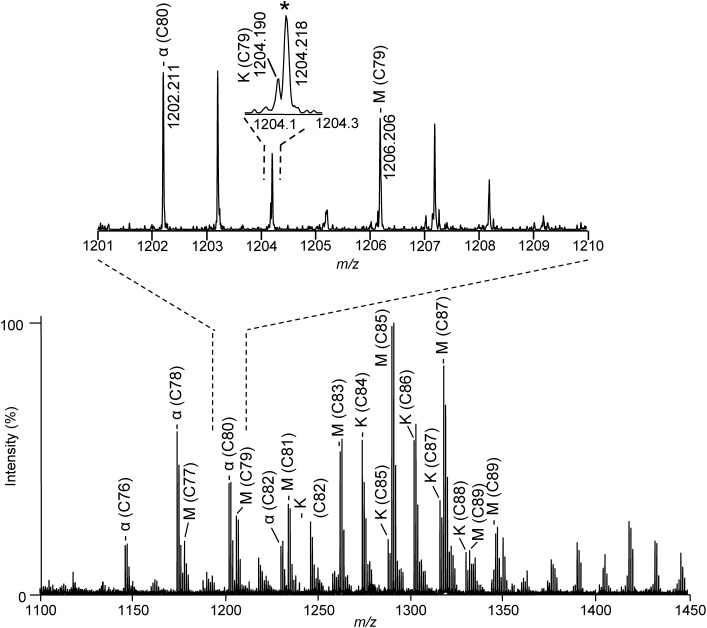
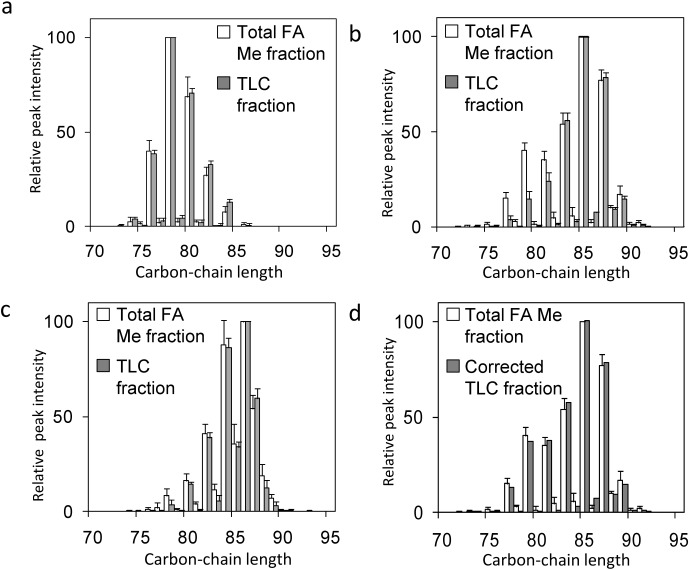
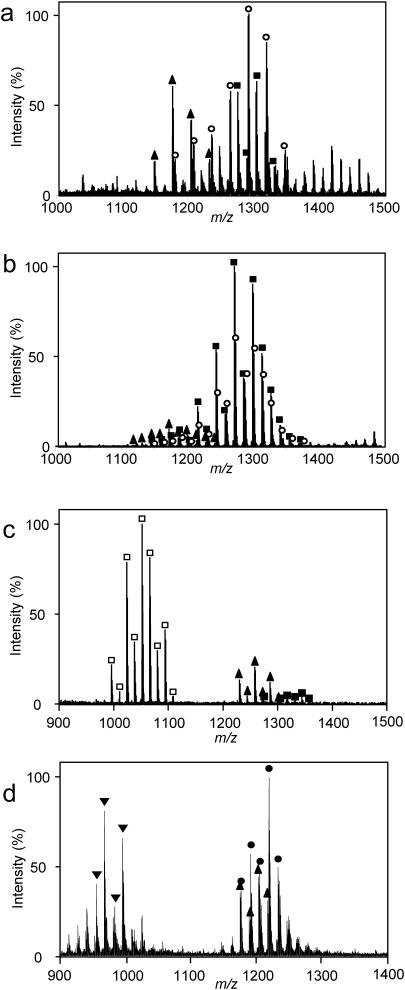
Mycolic acids (MAs) are characteristic components of bacteria in the suborder Corynebacterineae, such as Mycobacterium. MAs are categorized into subclasses based on their functional bases (cyclopropane ring, methoxy, keto, and epoxy group). Since MAs have heterogeneity among bacterial species, analyzing of MAs are required in the chemotaxonomic field. However, their structural analysis is not easy because of their long carbon-chain lengths and several functional groups. In this study, total fatty acid (FA) methyl ester (ME) fraction of M. tuberculosis H37Rv was analyzed by matrix-assisted laser desorption/ionization (MALDI) time-of-flight mass spectrometry (TOFMS) with a spiral ion trajectory (MALDI spiral-TOFMS). The distributions of carbon-chain length and their relative peak intensities were confirmed with those obtained by analysis of each subclass fraction which was separated from total FA ME fraction using thin-layer chromatography (TLC). The observed major peaks were reliably assigned as MAs owing to the high mass accuracy (error<3 ppm). The types of MA subclasses, their distributions of carbon-chain lengths, their relative peak intensities, and the ratio of even- and odd-numbered carbon-chain MAs for the total FA ME fraction were consistent with those of MA subclass fractions. To visualize whole MAs, contour maps of relative peak intensities for whole MAs were created. The contour maps indicated the MA subclasses and their distributions of carbon-chains with relative peak intensities at a glance. Our proposed method allows simple characterization in a short time and thus enables the analysis of large numbers of samples, and it would contribute to the chemotaxonomy.
Keywords: MALDI spiral-TOFMS; Mycobacterium; chemotaxonomy; contour map; mycolic acid.
Figures

Similar articles
-
Simple and rapid characterization of mycolic acids from Dietzia strains by using MALDI spiral-TOFMS with ultra high mass-resolving power.J Antibiot (Tokyo). 2013 Dec;66(12):713-7. doi: 10.1038/ja.2013.79. Epub 2013 Aug 28. J Antibiot (Tokyo). 2013. PMID: 23981960
-
Direct molecular mass determination of trehalose monomycolate from 11 species of mycobacteria by MALDI-TOF mass spectrometry.Microbiology (Reading). 2005 May;151(Pt 5):1443-1452. doi: 10.1099/mic.0.27791-0. Microbiology (Reading). 2005. PMID: 15870454
-
Comprehensive analysis of mycolic acid subclass and molecular species composition of Mycobacterium bovis BCG Tokyo 172 cell wall skeleton (SMP-105).J Microbiol Methods. 2008 Feb;72(2):149-56. doi: 10.1016/j.mimet.2007.11.016. Epub 2007 Nov 22. J Microbiol Methods. 2008. PMID: 18178279
-
Surface analysis of lipids by mass spectrometry: more than just imaging.Prog Lipid Res. 2013 Oct;52(4):329-53. doi: 10.1016/j.plipres.2013.04.005. Epub 2013 Apr 24. Prog Lipid Res. 2013. PMID: 23623802 Review.
-
Analysis of phospolipids and glycolipids by thin-layer chromatography-matrix-assisted laser desorption and ionization mass spectrometry.J Chromatogr A. 2012 Oct 12;1259:62-73. doi: 10.1016/j.chroma.2012.03.068. Epub 2012 Mar 28. J Chromatogr A. 2012. PMID: 22503924 Review.
Cited by
-
A reversed phase ultra-high-performance liquid chromatography-data independent mass spectrometry method for the rapid identification of mycobacterial lipids.J Chromatogr A. 2022 Jan 11;1662:462739. doi: 10.1016/j.chroma.2021.462739. Epub 2021 Dec 8. J Chromatogr A. 2022. PMID: 34929571 Free PMC article.
-
Killing of Mycolic Acid-Containing Bacteria Aborted Induction of Antibiotic Production by Streptomyces in Combined-Culture.PLoS One. 2015 Nov 6;10(11):e0142372. doi: 10.1371/journal.pone.0142372. eCollection 2015. PLoS One. 2015. PMID: 26544713 Free PMC article.
-
Cell wall channels of Rhodococcus species: identification and characterization of the cell wall channels of Rhodococcus corynebacteroides and Rhodococcus ruber.Eur Biophys J. 2022 Jul;51(4-5):309-323. doi: 10.1007/s00249-022-01599-9. Epub 2022 May 14. Eur Biophys J. 2022. PMID: 35567623 Free PMC article.
-
Biochemical Characterization of Isoniazid-resistant Mycobacterium tuberculosis: Can the Analysis of Clonal Strains Reveal Novel Targetable Pathways?Mol Cell Proteomics. 2018 Sep;17(9):1685-1701. doi: 10.1074/mcp.RA118.000821. Epub 2018 May 29. Mol Cell Proteomics. 2018. PMID: 29844232 Free PMC article.
-
Identification of a Desaturase Involved in Mycolic Acid Biosynthesis in Mycobacterium smegmatis.PLoS One. 2016 Oct 14;11(10):e0164253. doi: 10.1371/journal.pone.0164253. eCollection 2016. PLoS One. 2016. PMID: 27741286 Free PMC article.
References
-
- 1) K. Kaneda, S. Imaizumi, I. Yano. Distribution of C22-, C24- and C26-alpha-unit-containing mycolic acid homologues in mycobacteria. Microbiol. Immunol. 39: 563–570, 1995. - PubMed
-
- 2) M. Watanabe, Y. Aoyagi, M. Ridell, D. E. Minnikin. Separation and characterization of individual mycolic acids in representative mycobacteria. Microbiology 147: 1825–1837, 2001. - PubMed
-
- 3) D. E. Minnikin, S. M. Minnikin, G. Dobson, M. Goodfellow, F. Portaels, L. Vandenbreen, D. Sesardic. Mycolic acid patterns of four vaccine strains of Mycobacterium bovis BCG. J. Gen. Microbiol. 129: 889–891, 1983. - PubMed
-
- 4) M. Daffe, M. A. Laneelle, C. Asselineau, V. Levyfrebault, H. David. Taxonomic interest of mycobacterial fatty-acids: Proposal of a method for analysis. Ann. Microbiol. 134B: 241–256, 1983. - PubMed
-
- 5) C. E. Barry 3rd, R. E. Lee, K. Mdluli, A. E. Sampson, B. G. Schroeder, R. A. Slayden, Y. Yuan. Mycolic acids: Structure, biosynthesis and physiological functions. Prog. Lipid Res. 37: 143–179, 1998. - PubMed