

Multivariate analysis of the population representativeness of related clinical studies
- PMID: 26820188
- PMCID: PMC4837055
- DOI: 10.1016/j.jbi.2016.01.007
Multivariate analysis of the population representativeness of related clinical studies
Abstract
Objective: To develop a multivariate method for quantifying the population representativeness across related clinical studies and a computational method for identifying and characterizing underrepresented subgroups in clinical studies.
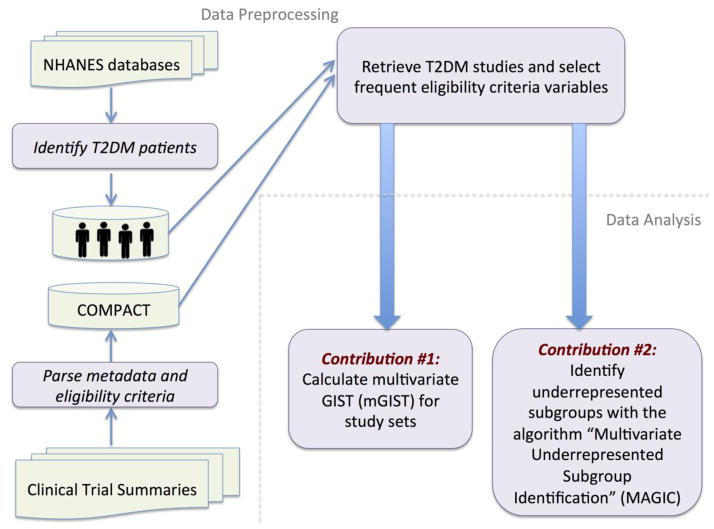
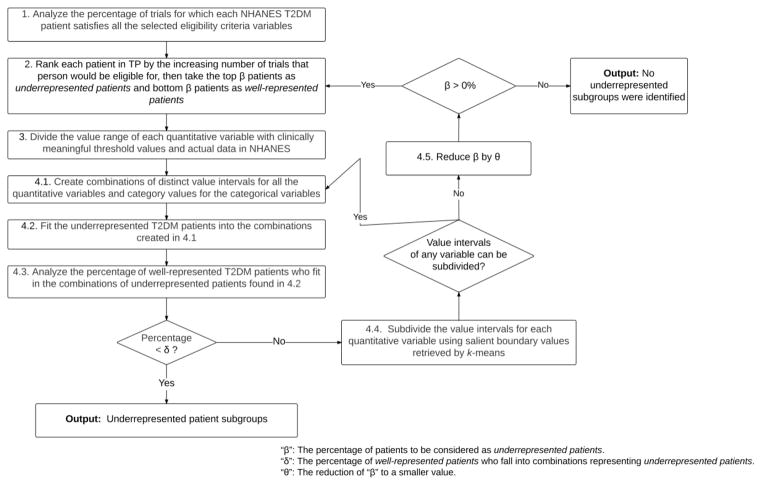
Methods: We extended a published metric named Generalizability Index for Study Traits (GIST) to include multiple study traits for quantifying the population representativeness of a set of related studies by assuming the independence and equal importance among all study traits. On this basis, we compared the effectiveness of GIST and multivariate GIST (mGIST) qualitatively. We further developed an algorithm called "Multivariate Underrepresented Subgroup Identification" (MAGIC) for constructing optimal combinations of distinct value intervals of multiple traits to define underrepresented subgroups in a set of related studies. Using Type 2 diabetes mellitus (T2DM) as an example, we identified and extracted frequently used quantitative eligibility criteria variables in a set of clinical studies. We profiled the T2DM target population using the National Health and Nutrition Examination Survey (NHANES) data.
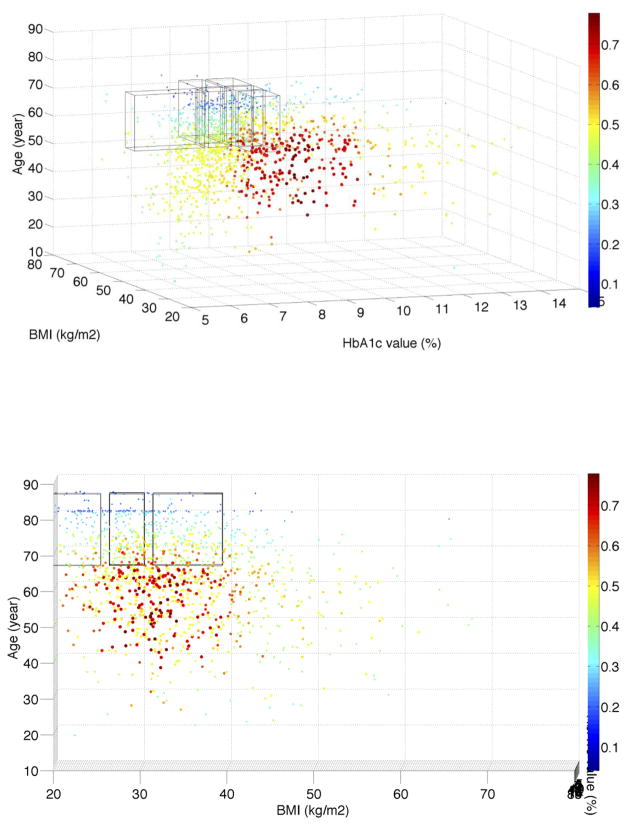
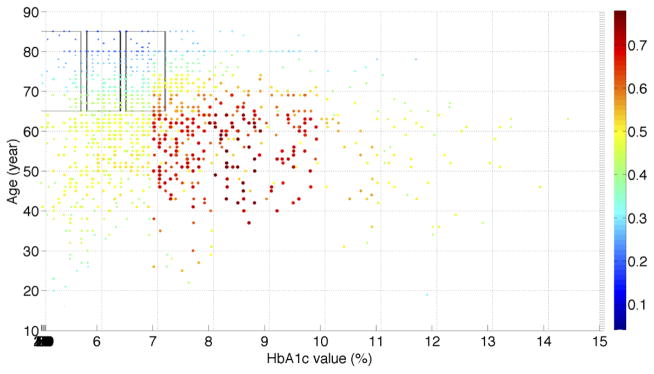
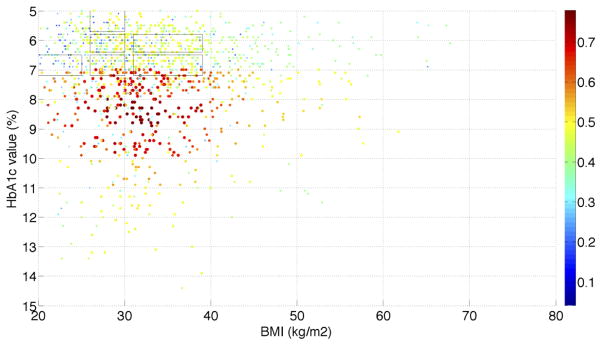
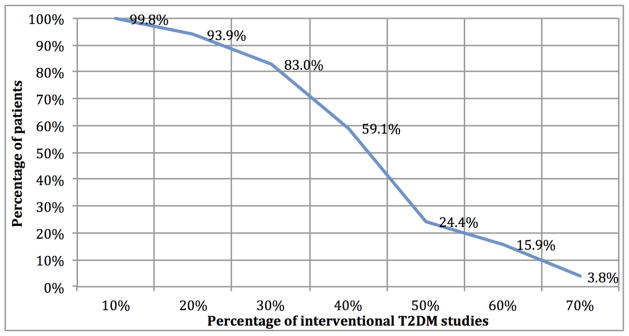
Results: According to the mGIST scores for four example variables, i.e., age, HbA1c, BMI, and gender, the included observational T2DM studies had superior population representativeness than the interventional T2DM studies. For the interventional T2DM studies, Phase I trials had better population representativeness than Phase III trials. People at least 65years old with HbA1c value between 5.7% and 7.2% were particularly underrepresented in the included T2DM trials. These results confirmed well-known knowledge and demonstrated the effectiveness of our methods in population representativeness assessment.
Conclusions: mGIST is effective at quantifying population representativeness of related clinical studies using multiple numeric study traits. MAGIC identifies underrepresented subgroups in clinical studies. Both data-driven methods can be used to improve the transparency of design bias in participation selection at the research community level.
Keywords: Clinical trial; Knowledge representation; Selection bias.
Copyright © 2016 Elsevier Inc. All rights reserved.
Conflict of interest statement
None.
Figures
Similar articles
-
Simulation-based Evaluation of the Generalizability Index for Study Traits.AMIA Annu Symp Proc. 2015 Nov 5;2015:594-603. eCollection 2015. AMIA Annu Symp Proc. 2015. PMID: 26958194 Free PMC article.
-
The representativeness of eligible patients in type 2 diabetes trials: a case study using GIST 2.0.J Am Med Inform Assoc. 2018 Mar 1;25(3):239-247. doi: 10.1093/jamia/ocx091. J Am Med Inform Assoc. 2018. PMID: 29025047 Free PMC article.
-
GIST 2.0: A scalable multi-trait metric for quantifying population representativeness of individual clinical studies.J Biomed Inform. 2016 Oct;63:325-336. doi: 10.1016/j.jbi.2016.09.003. Epub 2016 Sep 4. J Biomed Inform. 2016. PMID: 27600407 Free PMC article.
-
Measuring Representativeness in Clinical Trials.Circulation. 2025 Feb 4;151(5):318-330. doi: 10.1161/CIRCULATIONAHA.124.070299. Epub 2025 Feb 3. Circulation. 2025. PMID: 39899634 Review.
-
Pioglitazone for prevention or delay of type 2 diabetes mellitus and its associated complications in people at risk for the development of type 2 diabetes mellitus.Cochrane Database Syst Rev. 2020 Nov 19;11(11):CD013516. doi: 10.1002/14651858.CD013516.pub2. Cochrane Database Syst Rev. 2020. PMID: 33210751 Free PMC article.
Cited by
-
Assessing the use of prescription drugs and dietary supplements in obese respondents in the National Health and Nutrition Examination Survey.PLoS One. 2022 Jun 3;17(6):e0269241. doi: 10.1371/journal.pone.0269241. eCollection 2022. PLoS One. 2022. PMID: 35657782 Free PMC article.
-
Clinical Trial Generalizability Assessment in the Big Data Era: A Review.Clin Transl Sci. 2020 Jul;13(4):675-684. doi: 10.1111/cts.12764. Epub 2020 Apr 10. Clin Transl Sci. 2020. PMID: 32058639 Free PMC article.
-
Assessing the Validity of a a priori Patient-Trial Generalizability Score using Real-world Data from a Large Clinical Data Research Network: A Colorectal Cancer Clinical Trial Case Study.AMIA Annu Symp Proc. 2020 Mar 4;2019:1101-1110. eCollection 2019. AMIA Annu Symp Proc. 2020. PMID: 32308907 Free PMC article.
-
Novel stepwise approach to assess representativeness of a large multicenter observational cohort of tuberculosis patients: The example of RePORT Brazil.Int J Infect Dis. 2021 Feb;103:110-118. doi: 10.1016/j.ijid.2020.11.140. Epub 2020 Nov 14. Int J Infect Dis. 2021. PMID: 33197582 Free PMC article.
-
Computational strategic recruitment for representation and coverage studied in the All of Us Research Program.NPJ Digit Med. 2025 Jul 3;8(1):402. doi: 10.1038/s41746-025-01804-x. NPJ Digit Med. 2025. PMID: 40610586 Free PMC article.
References
-
- From the NIH Director: The Importance of Clinical Trials. 2014 Apr 9; Available from: http://www.nlm.nih.gov/medlineplus/magazine/issues/summer11/articles/sum....
-
- Filion M, Forget G, Brochu O, Provencher L, Desbiens C, Doyle C, et al. Eligibility criteria in randomized phase II and III adjuvant and neoadjuvant breast cancer trials: not a significant barrier to enrollment. Clin Trials. 9(5):652–9. - PubMed
-
- Weisberg HI, Hayden VC, Pontes VP. Selection criteria and generalizability within the counterfactual framework: explaining the paradox of antidepressant-induced suicidality? Clin Trials. 2009;6(2):109–18. - PubMed
-
- Rothwell PM. External validity of randomised controlled trials: “to whom do the results of this trial apply?”. Lancet. 2005;365(9453):82–93. - PubMed
-
- Leaf C. The New York Times. 2013. Do Clinical Trials Work?
Publication types
MeSH terms
Grants and funding
LinkOut - more resources
Full Text Sources
Other Literature Sources
