

Ocular Drug Distribution After Topical Administration: Population Pharmacokinetic Model in Rabbits
- PMID: 26820265
- PMCID: PMC5306244
- DOI: 10.1007/s13318-016-0319-4
Ocular Drug Distribution After Topical Administration: Population Pharmacokinetic Model in Rabbits
Abstract
Background and objective: When eye diseases are treated by topical administration, the success of treatment lies in the effective drug concentration in the target tissue. This is why the drug's pharmacokinetic, in the different substructures of the eye, needs to be explored more accurately during drug development. The aim of the present analysis was to describe by rabbit model, the distribution of a drug after ocular instillation in the selected eye tissues and fluids.
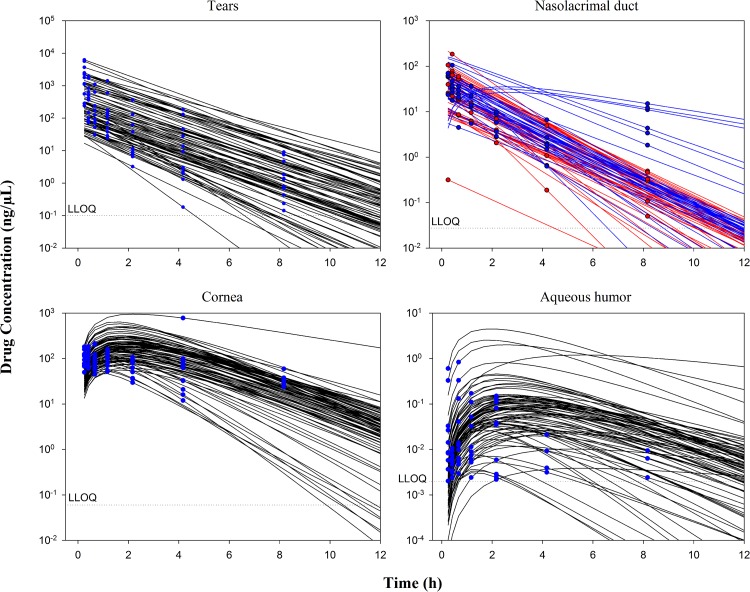
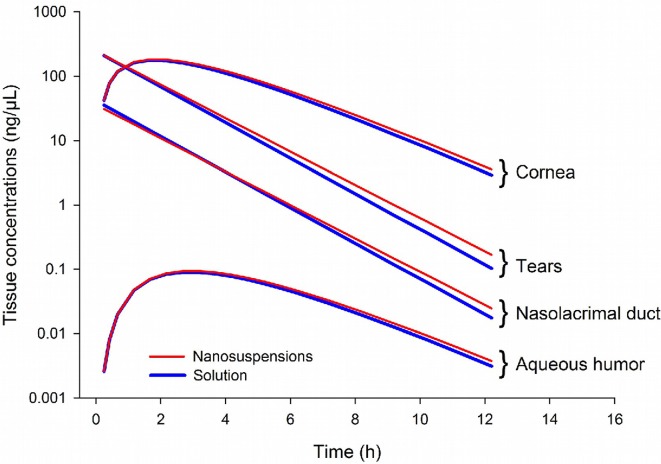
Methods: By a top-down population approach, we developed and validated a population pharmacokinetics (PopPK) model, using tissue concentrations (tear, naso-lacrymal duct, cornea and aqueous humor) of a new src tyrosine kinase inhibitor (FV-60165) in each anterior segment's tissue and fluid of the rabbit eye. Inter-individual variability was estimated and the impact of the formulation (solution or nanosuspension) was evaluated.
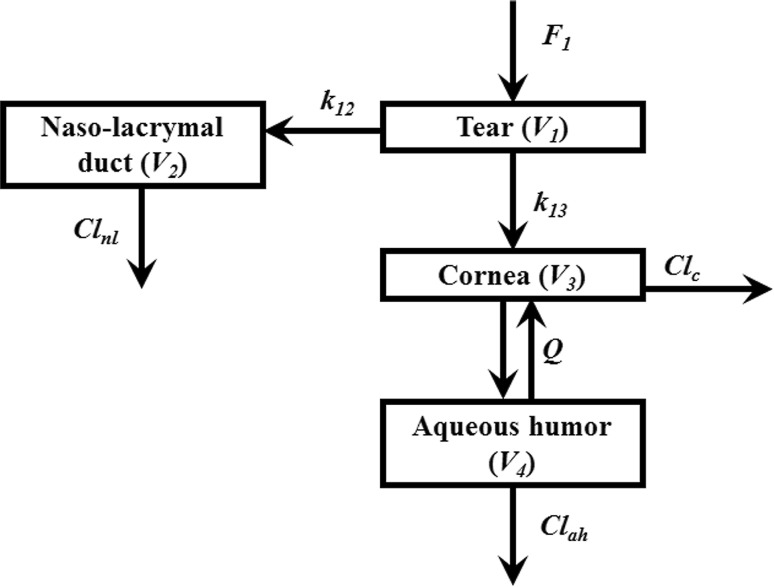
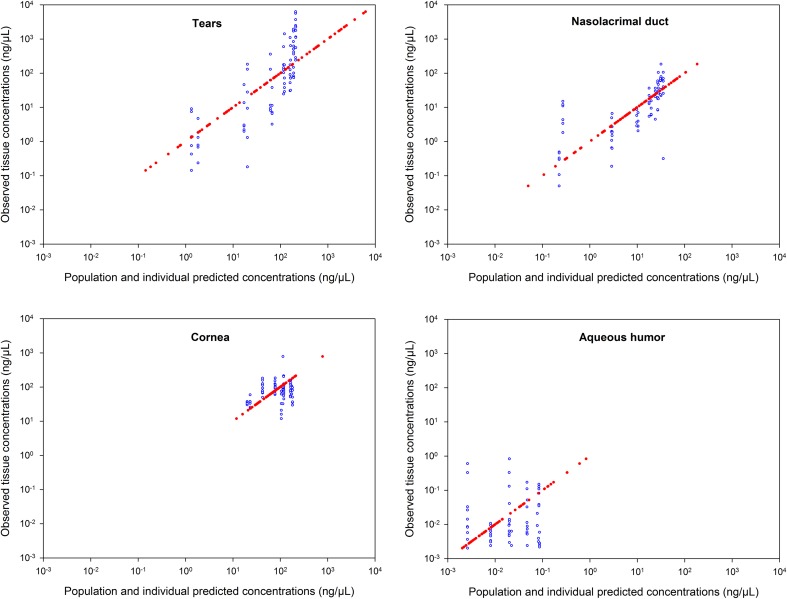
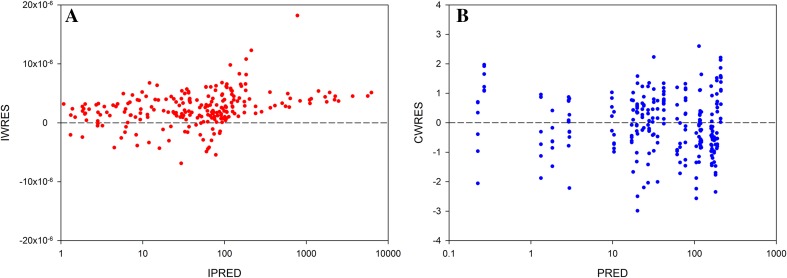
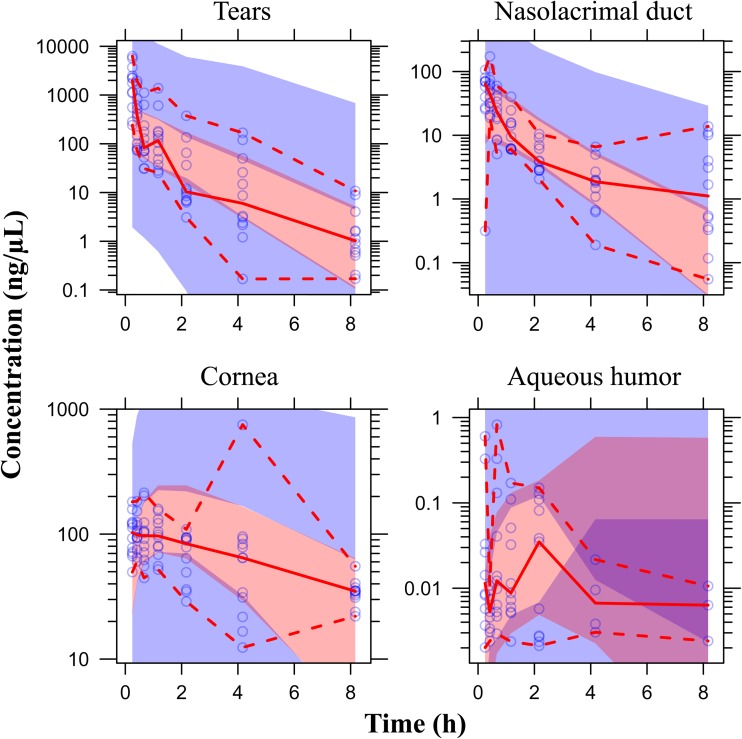
Results: The model structure selected for the eye is a 4-compartment model with the formulation as a significant covariate on the first-order rate constant between tears and the naso-lacrymal duct. The model showed a good predictive performance and may be used to estimate the concentration-time profiles after single or repeated administration, in each substructure of the eye for each animal included in the analysis.
Conclusions: This analysis allowed describing the distribution of a drug in the different selected tissues and fluids in the rabbit's eyes after instillation of the prodrug as a solution or nanosuspension.
Conflict of interest statement
Compliance with Ethical Standards Funding No sources of funding were received for the conduct of this study. Conflicts of interest ND, SK, FG, A-LC, AT, GF, CL and DF have no potential conflicts of interests to declare. Ethical approval The experimental design was approved by the local “Comité d’Ethique pour la Protection des Animaux de Laboratoire” (Animal Care and Use Committee) and the study was performed in accordance with the internal Charter on the Humane Care and Use of Laboratory Animals.
Figures
References
-
- Torkildsen G, O’Brien TP. Conjunctival tissue pharmacokinetic properties of topical azithromycin 1 % and moxifloxacin 0.5 % ophthalmic solutions: a single-dose, randomized, open-label, active-controlled trial in healthy adult volunteers. Clin Ther. 2008;30:2005–2014. doi: 10.1016/j.clinthera.2008.10.020. - DOI - PubMed
-
- Schmitz K, Banditt P, Motschmann M, et al. Population pharmacokinetics of 2 % topical dorzolamide in the aqueous humor of humans. Invest Ophthalmol Vis Sci. 1999;40:1621–1624. - PubMed
MeSH terms
Substances
LinkOut - more resources
Full Text Sources
Other Literature Sources
Miscellaneous
