. 2016 Jan 28;11(1):e0147390.
doi: 10.1371/journal.pone.0147390. eCollection 2016.

Inhibition of Prostaglandin Reductase 2, a Putative Oncogene Overexpressed in Human Pancreatic Adenocarcinoma, Induces Oxidative Stress-Mediated Cell Death Involving xCT and CTH Gene Expressions through 15-Keto-PGE2

Affiliations

Inhibition of Prostaglandin Reductase 2, a Putative Oncogene Overexpressed in Human Pancreatic Adenocarcinoma, Induces Oxidative Stress-Mediated Cell Death Involving xCT and CTH Gene Expressions through 15-Keto-PGE2

Emily Yun-Chia Chang et al. PLoS One. .

Abstract

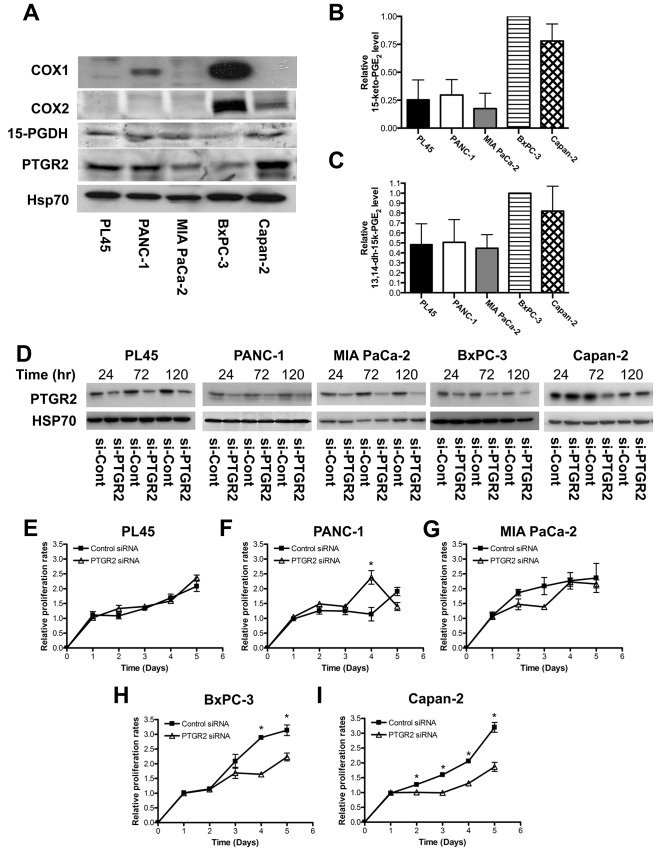
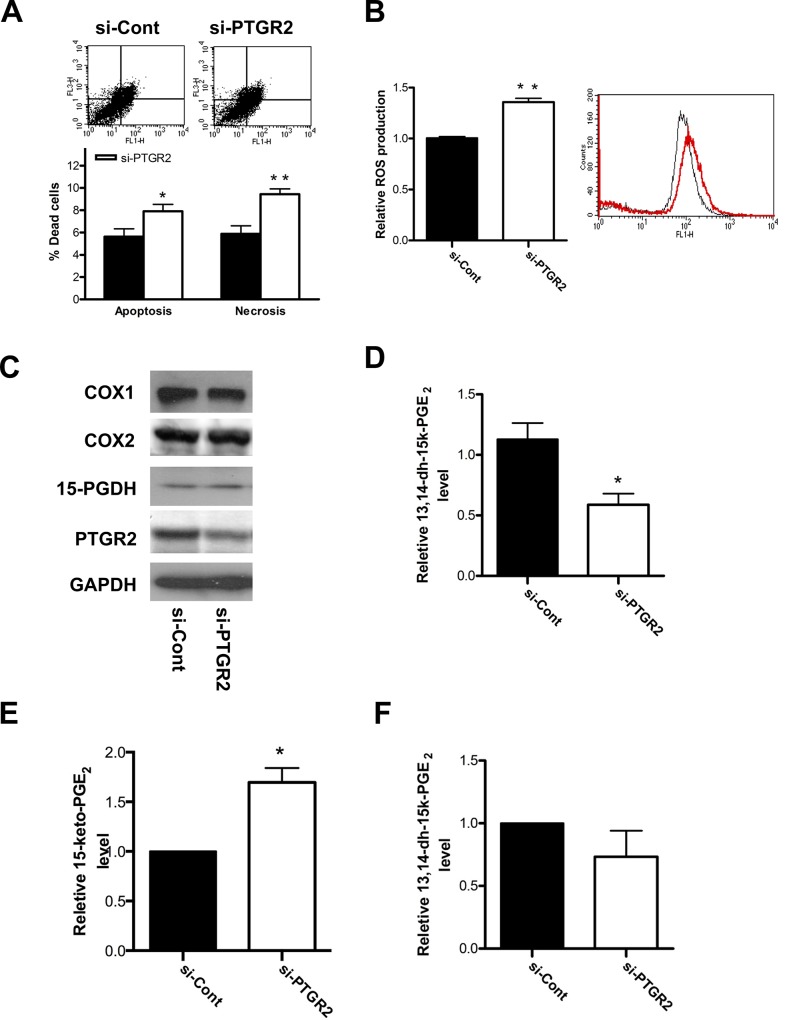
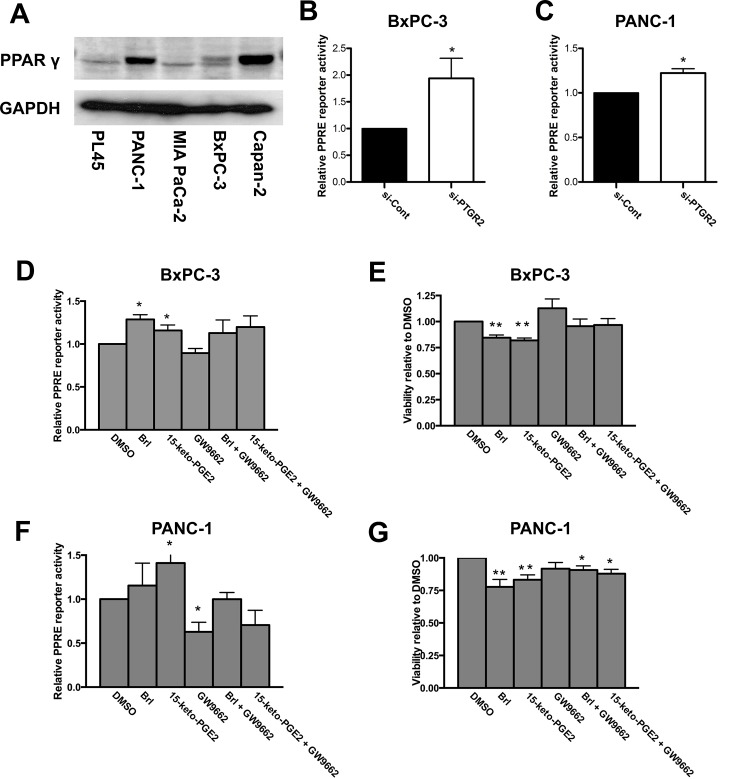
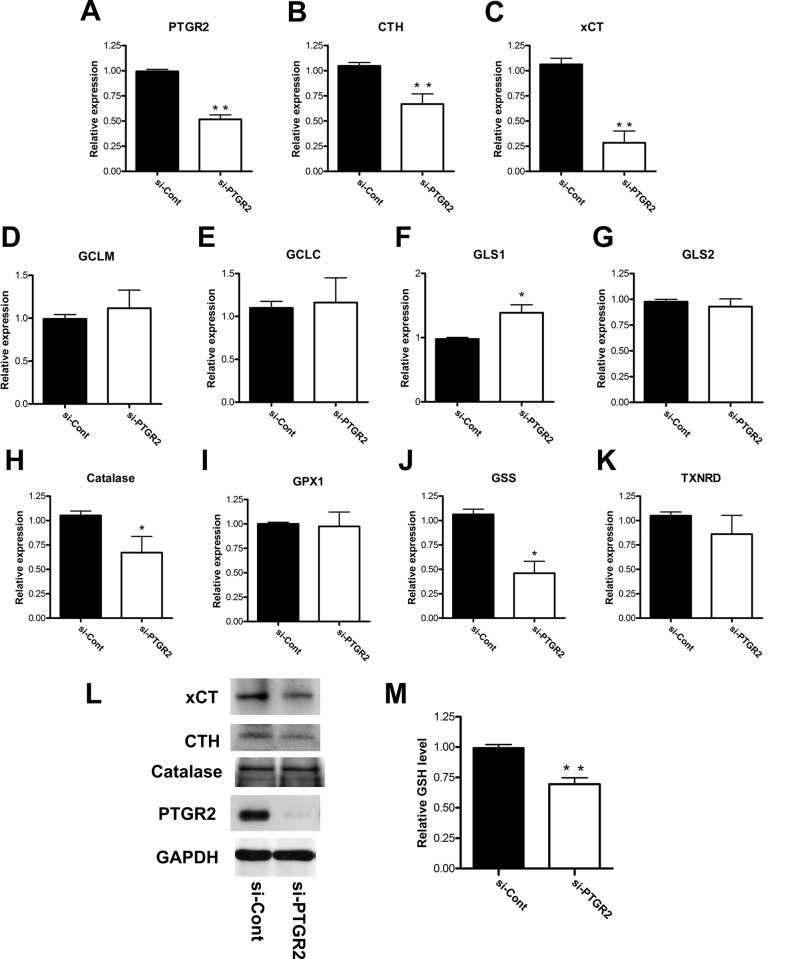
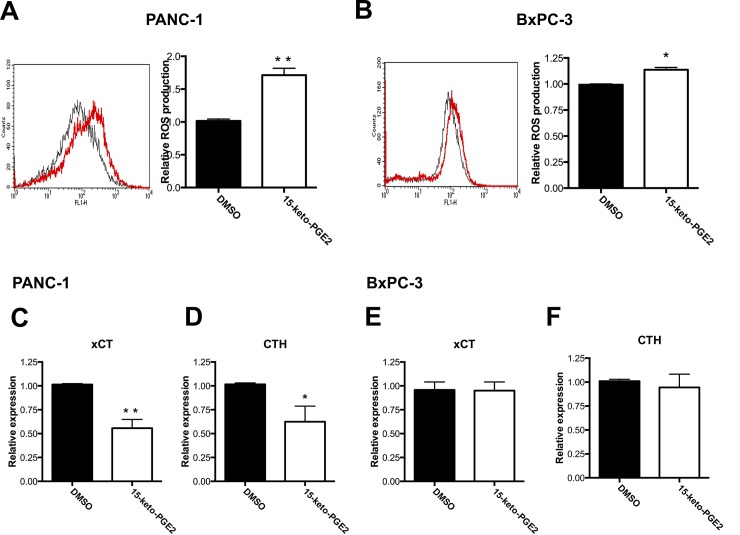
Prostaglandin reductase 2 (PTGR2) is the enzyme that catalyzes 15-keto-PGE2, an endogenous PPARγ ligand, into 13,14-dihydro-15-keto-PGE2. Previously, we have reported a novel oncogenic role of PTGR2 in gastric cancer, where PTGR2 was discovered to modulate ROS-mediated cell death and tumor transformation. In the present study, we demonstrated the oncogenic potency of PTGR2 in pancreatic cancer. First, we observed that the majority of the human pancreatic ductal adenocarcinoma tissues was stained positive for PTGR2 expression but not in the adjacent normal parts. In vitro analyses showed that silencing of PTGR2 expression enhanced ROS production, suppressed pancreatic cell proliferation, and promoted cell death through increasing 15-keto-PGE2. Mechanistically, silencing of PTGR2 or addition of 15-keto-PGE2 suppressed the expressions of solute carrier family 7 member 11 (xCT) and cystathionine gamma-lyase (CTH), two important providers of intracellular cysteine for the generation of glutathione (GSH), which is widely accepted as the first-line antioxidative defense. The oxidative stress-mediated cell death after silencing of PTGR2 or addition of 15-keto-PGE2 was further abolished after restoring intracellular GSH concentrations and cysteine supply by N-acetyl-L-cysteine and 2-Mercaptomethanol. Our data highlight the therapeutic potential of targeting PTGR2/15-keto-PGE2 for pancreatic cancer.


Conflict of interest statement

Competing Interests: The authors have declared that no competing interests exist.

Figures

Fig 1
Fig 1. PTGR2 protein expression in human pancreatic ductal adenocarcinoma tissues.
(A and C) Two representative tissue sections (obtained from 76 patients) of pancreatic ductal adenocarcinoma tissues with adjacent normal tissues. Immunohistochemical staining was performed using a specific anti-PTGR2 antibody. Tumor regions were stained positive for PTGR2 (dark brown) whereas majority of the adjacent normal tissue cells were stained negative for PTGR2. Magnification X100. (B and D) Higher magnifications of (A) and (C) respectively for PTGR2-positive regions. Magnification 200X.)
Fig 2
Fig 2. Silencing of PTGR2 suppressed growth rates of pancreatic cancer cells capable of self-producing abundant prostaglandins.
(A) Western blot analysis of expression levels of COX1, COX2, 15-PGDH, and PTGR2 in PL45, PANC-1, MIA PaCa-2, BxPC-3, and Capan-2 cells. Hsp70 served as a loading control. (B and C) Relative levels of intracellular (B) 15-keto-PGE2 and (C) 13,14-dihydro-15keto-PGE2 isolated from various pancreatic cancer cell lines. The concentrations of 15-keto-PGE2 and 13,14-dihydro-15keto-PGE2 extracted from BxPC-3 were set as 1, and the relative levels of 15-keto-PGE2 and 13,14-dihydro-15-keto-PGE2 from other cell lines were presented as values relative to BxPC-3 cells. Prostaglandins were isolated and analyzed by LC-MS/MS. The results are the average of 4 independent experiments. (D) Efficiency of siRNA-mediated PTGR2 silencing. PTGR2 protein expression in PL45, PANC-1, MIA PaCa-2, BxPC-3 and Capan-2 cells was detected by Western blot analysis. Hsp70 served as a loading control. Time indicated hours post-siRNA transfection. (EI) Relative proliferation rates of (E) PL45 (F) PANC-1 (G) MIA PaCa-2 (H) BxPC-3 and (I) Capan-2 si-PTGR2 cells as compared to si-Control cells. Cell proliferation was evaluated by MTS assay at the indicated time points. 48 hours post-transfection was set as Day 1. The values were obtained from 2 independent experiments each done in triplicate. Data are presented as the mean ± SE. * P < 0.05, Student’s t-test.
Fig 3
Fig 3. Silencing of PTGR2 promoted cell death and ROS production and induced 15-keto-PGE2 in BxPC-3 cells.
(A) The percentage of dead cells in si-PTGR2 BxPC-3 cells as compared to si-Control cells was evaluated by Annexin V and 7-AAD staining. The flow cytometry plots show annexin V-FITC binding (FL1-H) and 7-AAD staining (FL3-H). The bar graph distinguish dead cells as apoptotic or necrotic. The results are the average of 4 independent experiments each done in triplicate. (B) Relative ROS production in si-PTGR2 (red profile) BxPC-3 cells as compared to si-Control (black profile) cells. ROS was detected using H2DCF dye and flow cytometry. The results are the average of 3 independent experiments each done in triplicate. (C) Western blot analysis of the expression levels of COX1, COX2, 15-PGDH and PTGR2 in si-PTGR2 BxPC-3 cells. GAPDH served as a loading control. (D) Relative production of 13,14-dihydro-15-keto-PGE2 in si-PTGR2 BxPC-3 cells as compared to si-Control cells. The concentration for si-Control cells was set as 1, and the relative levels of 13,14-dihydro-15-keto-PGE2 in si-PTGR2 cells was presented as values relative to the control. The values were obtained from 2 independent experiments each done in triplicate. (E and F) Relative levels of intracellular (E) 15-keto-PGE2 and (F) 13,14-dihydro-15-keto-PGE2 isolated from si-PTGR2 BxPC-3 cells as compared to si-Control cells. The concentrations of 15-keto-PGE2 and 13,14-dihydro-15-keto-PGE2 extracted from si-Control cells were set as 1, and the relative levels of 15-keto-PGE2 and 13,14-dihydro-15-keto-PGE2 from si-PTGR2 cells were presented as values relative to the control. Prostaglandins were isolated and analyzed by LC-MS/MS. The results are the average of 3 independent experiments. Data are presented as the mean ± SE. * P < 0.05, ** P < 0.01, Student’s t-test.
Fig 4
Fig 4. Suppressed cell viability induced by 15-keto-PGE2 is not entirely dependent on PPARγ activity.
(A) Western blot analysis of the expression level of PPARγ in PL45, PANC-1, MIA PaCa-2, BxPC-3, and Capan-2 cells. GAPDH served as a loading control. (B, C, D and F) After (B and C) siRNA treatment or (D and F) drug treatment for 3 hours, cells were further transfected with reporter plasmids and luciferase activity was measured in (B and D) BxPC-3 and (C and F) PANC-1 cells. Luciferase activity for si-Control or DMSO-treated cells was set as 1, and the relative luciferase activity for si-PTGR2 or drug-treated cells was presented as value relative to the control. The results for (B and C) are the average of 4 independent experiments each done in triplicate and the results for (D and F) are the average of 3 independent experiments each done in duplicates. (E and G) Cell viability of (E) BxPC-3 and (G) PANC-1 cells was performed by crystal violet stain and quantified by measuring the absorbance at 590nm after isopropanol wash. Cells were treated with DMSO or 15-keto-PGE2 overnight. The viability of cells treated with DMSO was set as 1 and the relative level of viability of drug-treated cells was presented as value relative to the control. The results are the average of 4 independent experiments. Data are presented as the mean ± SE. * P < 0.05, ** P < 0.01, Student’s t-test.
Fig 5
Fig 5. Silencing of PTGR2 suppressed expression levels of antioxidative genes xCT and CTH and total cellular glutathione level in BxPC-3 cells.
(AK) Relative mRNA expression levels of (A) PTGR2 (B) CTH (C) xCT (D) GCLM (E) GCLC (F) GLS1 (G) GLS2 (H) Catalase (I) GPX1 (J) GSS and (K) TXNRD in si-PTGR2 BxPC-3 cells as compared to si-Control cells. Total RNA was harvested and subjected to qRT-PCR analysis and the mRNA levels were normalized to human cyclophilin expression level. mRNA expression levels in si-Control cells were set as 1 and the relative mRNA expression levels in si-PTGR2 cells were presented as values relative to the control. The results are the average of 3 independent experiments each done in triplicate. (L) Western blot analysis of the expression levels of xCT, CTH, Catalase and PTGR2 in si-PTGR2 BxPC-3 cells. GAPDH served as a loading control. (M) Total GSH level in si-PTGR2 BxPC-3 cells as compared to si-Control cells. The GSH level in si-Control cells was set as 1 and the GSH level in si-PTGR2 cells was presented as values relative to the control. The results are the average of 3 independent experiments each done in triplicate. Data are presented as the mean ± SE. * P < 0.05, ** P < 0.01, Student’s t-test.
Fig 6
Fig 6. Effects of 15-keto-PGE2 on ROS production and antioxidative genes xCT and CTH.
(A and B) Relative ROS production in 15-keto-PGE2-treated (red profile) (A) PANC-1 and (B) BxPC-3 cells as compared to DMSO-treated (black profile) cells. Cells were treated with DMSO or 15-keto-PGE2 overnight and ROS was detected using H2DCF dye and flow cytometry. The results are the average of 3 independent experiments each done in triplicate. (C–F) Relative mRNA expression levels of (C and E) xCT and (D and F) CTH in 15-keto-PGE2-treated (C and D) PANC-1 or (E and F) BxPC-3 cells as compared to DMSO-treated cells. Cells were treated with DMSO or 15-keto-PGE2 overnight and total RNA was harvested and subjected to qRT-PCR analysis. The mRNA levels were normalized to human cyclophilin expression level. mRNA expression levels in DMSO-treated cells were set as 1 and the relative mRNA expression levels in 15-keto-PGE2-treated cells were presented as values relative to the control. The results are the average of 3 independent experiments each done in triplicate. Data are presented as the mean ± SE. * P < 0.05, ** P < 0.01, Student’s t-test.
Fig 7
Fig 7. Induced cell death by 15-keto-PGE2 in PANC-1 cells or in PTGR2-silenced BxPC-3 cells could be reversed by restoring GSH level or intracellular cysteine supply.
(A) Total GSH level was measured in PANC-1 cells treated with the indicated drugs overnight. The GSH level in DMSO-treated cells was set as 1 and the GSH level in other drug-treated cells was presented as values relative to the control. The results are the average of 5 independent experiments each done in duplicate. (B) After si-RNA treatment in BxPC-3 cells, cells were further treated with DMSO, NAC or 2-ME overnight and total GSH level was measured. The GSH level in si-Control cells treated with DMSO was set as 1 and the GSH level in NAC, 2-ME and si-PTGR2 cells was presented as values relative to the control. The results are the average of 3 independent experiments each done in duplicate. (C and D) Levels of (C) apoptotic and (D) necrotic cells in PANC-1 cells treated with the indicated drugs overnight were evaluated by Annexin V and 7-AAD staining followed by flow cytometry. The level of dead cells treated with DMSO was set as 1 and the level of dead cells in other drug-treated cells was presented as values relative to the control. The results are the average of 4 independent experiments each done in triplicate. (E and F) After si-RNA treatment, BxPC-3 cells were further treated with DMSO, NAC or 2-ME overnight and the level of (E) apoptotic and (F) necrotic cells was evaluated by Annexin V and 7-AAD staining followed by flow cytometry. The level of dead cells in si-Control cells treated with DMSO was set as 1 and the level of dead cells in NAC, 2-ME and si-PTGR2 cells was presented as values relative to the control. The results are the average of 4 independent experiments each done in triplicate. Data are presented as the mean ± SE. * P < 0.05, ** P < 0.01, Student’s t-test.

Similar articles

Cited by

References

    1. Eibl G, Takata Y, Boros LG, Liu J, Okada Y, Reber HA, et al. Growth stimulation of COX-2-negative pancreatic cancer by a selective COX-2 inhibitor. Cancer Res. 2005;65(3):982–90. - PubMed
    1. Yamaue H, Satoi S, Kanbe T, Miyazawa M, Tani M, Kawai M, et al. Phase II clinical study of alternate-day oral therapy with S-1 as first-line chemotherapy for locally advanced and metastatic pancreatic cancer. Cancer Chemother Pharmacol. 2013. - PubMed
    1. Chu J, Lloyd FL, Trifan OC, Knapp B, Rizzo MT. Potential involvement of the cyclooxygenase-2 pathway in the regulation of tumor-associated angiogenesis and growth in pancreatic cancer. Mol Cancer Ther. 2003;2(1):1–7. - PubMed
    1. Chou WL, Chuang LM, Chou CC, Wang AH, Lawson JA, FitzGerald GA, et al. Identification of a novel prostaglandin reductase reveals the involvement of prostaglandin E2 catabolism in regulation of peroxisome proliferator-activated receptor gamma activation. J Biol Chem. 2007;282(25):18162–72. - PubMed
    1. Wu YH, Ko TP, Guo RT, Hu SM, Chuang LM, Wang AH. Structural basis for catalytic and inhibitory mechanisms of human prostaglandin reductase PTGR2. Structure. 2008;16(11):1714–23. 10.1016/j.str.2008.09.007 - DOI - PubMed

Publication types

MeSH terms