

Microelectrode array stimulation combined with intrinsic optical imaging: A novel tool for functional brain mapping
- PMID: 26820903
- PMCID: PMC4801717
- DOI: 10.1016/j.jneumeth.2016.01.018
Microelectrode array stimulation combined with intrinsic optical imaging: A novel tool for functional brain mapping
Abstract
Background: Functional brain mapping via cortical microstimulation is a widely used clinical and experimental tool. However, data are traditionally collected point by point, making the technique very time consuming. Moreover, even in skilled hands, consistent penetration depths are difficult to achieve. Finally, the effects of microstimulation are assessed behaviorally, with no attempt to capture the activity of the local cortical circuits being stimulated.
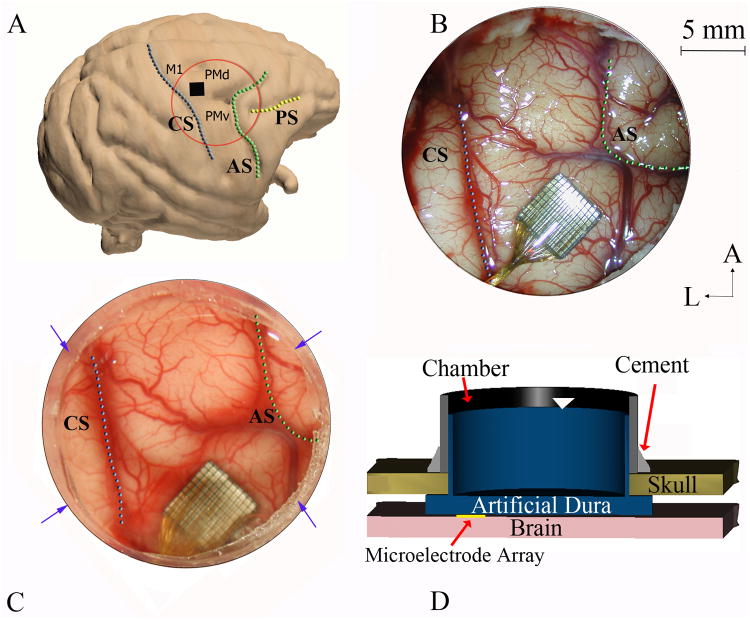
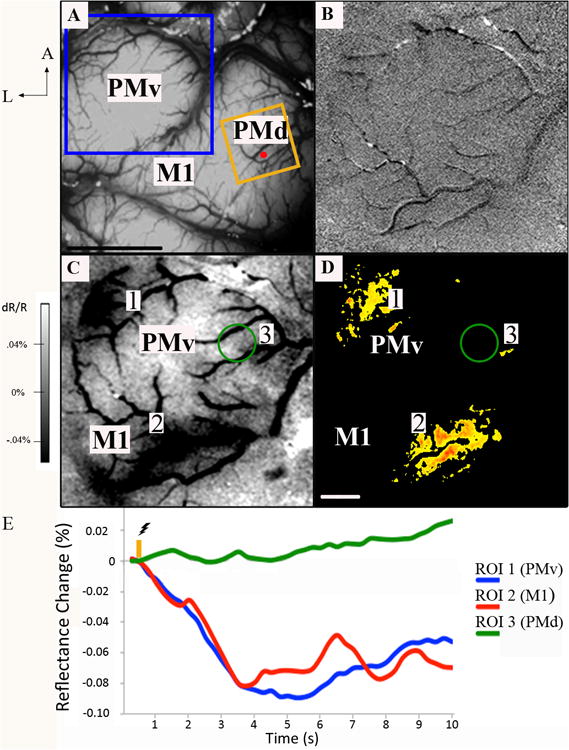
New method: We propose a novel method for functional brain mapping, which combines the use of a microelectrode array with intrinsic optical imaging. The precise spacing of electrodes allows for fast, accurate mapping of the area of interest in a regular grid. At the same time, the optical window allows for visualization of local neural connections when stimulation is combined with intrinsic optical imaging.
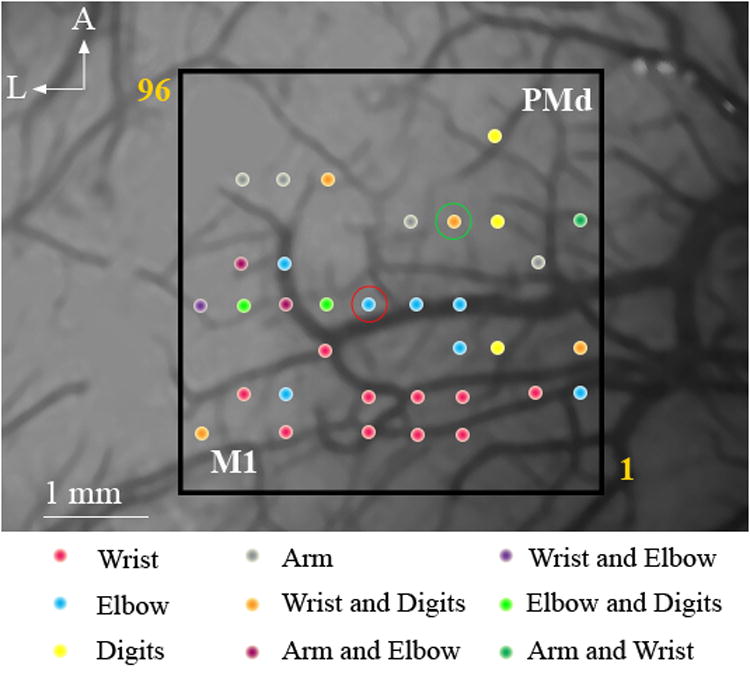
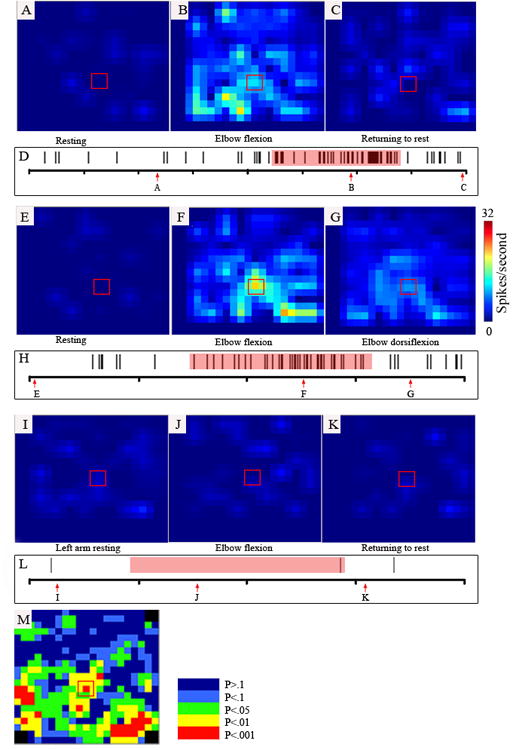
Results: We demonstrate the efficacy of our technique using the primate motor cortex as a sample application, using a combination of microstimulation, imaging and electrophysiological recordings during wakefulness and under anesthesia. Comparison with current method: We find the data collected with our method is consistent with previous data published by others. We believe that our approach enables data to be collected faster and in a more consistent fashion and makes possible a number of studies that would be difficult to carry out with the traditional approach.
Conclusions: Our technique allows for simultaneous modulation and imaging of cortical sensorimotor networks in wakeful subjects over multiple sessions which is highly desirable for both the study of cortical organization and the design of brain machine interfaces.
Keywords: Cortical mapping; Functional tract tracing; Microstimulation; Optical chamber; Utah array.
Copyright © 2016 Elsevier B.V. All rights reserved.
Conflict of interest statement
Figures
Similar articles
-
Optical imaging of cortical networks via intracortical microstimulation.J Neurophysiol. 2013 Dec;110(11):2670-8. doi: 10.1152/jn.00879.2012. Epub 2013 Sep 11. J Neurophysiol. 2013. PMID: 24027103 Free PMC article.
-
Prenatal alcohol exposure reduces the size of the forelimb representation in motor cortex in rat: an intracortical microstimulation (ICMS) mapping study.Alcohol. 2010 Mar;44(2):185-94. doi: 10.1016/j.alcohol.2009.10.014. Epub 2010 Jan 18. Alcohol. 2010. PMID: 20083368
-
Mapping mesoscale cortical connectivity in monkey sensorimotor cortex with optical imaging and microstimulation.J Comp Neurol. 2020 Dec 1;528(17):3095-3107. doi: 10.1002/cne.24918. Epub 2020 May 4. J Comp Neurol. 2020. PMID: 32255200 Free PMC article.
-
Supracortical Microstimulation: Advances in Microelectrode Design and In Vivo Validation.Annu Rev Biomed Eng. 2025 May;27(1):235-254. doi: 10.1146/annurev-bioeng-103023-072855. Epub 2025 Feb 6. Annu Rev Biomed Eng. 2025. PMID: 39914882 Review.
-
Large-Scale Gradients in Human Cortical Organization.Trends Cogn Sci. 2018 Jan;22(1):21-31. doi: 10.1016/j.tics.2017.11.002. Epub 2017 Dec 1. Trends Cogn Sci. 2018. PMID: 29203085 Review.
Cited by
-
Electrocorticographic Temporal Alteration Mapping: A Clinical Technique for Mapping the Motor Cortex with Movement-Related Cortical Potentials.Front Neurosci. 2017 Jun 12;11:326. doi: 10.3389/fnins.2017.00326. eCollection 2017. Front Neurosci. 2017. PMID: 28659752 Free PMC article.
-
Review of functional and clinical relevance of intrinsic signal optical imaging in human brain mapping.Neurophotonics. 2017 Jul;4(3):031220. doi: 10.1117/1.NPh.4.3.031220. Epub 2017 Jun 9. Neurophotonics. 2017. PMID: 28630881 Free PMC article. Review.
-
The decoupling between hemodynamic parameters and neural activity implies a complex origin of spontaneous brain oscillations.Front Comput Neurosci. 2023 Jul 31;17:1214793. doi: 10.3389/fncom.2023.1214793. eCollection 2023. Front Comput Neurosci. 2023. PMID: 37583895 Free PMC article.
-
Effective Connectivity Measured Using Optogenetically Evoked Hemodynamic Signals Exhibits Topography Distinct from Resting State Functional Connectivity in the Mouse.Cereb Cortex. 2018 Jan 1;28(1):370-386. doi: 10.1093/cercor/bhx298. Cereb Cortex. 2018. PMID: 29136125 Free PMC article.
References
-
- Koehler PJ. Eduard Hitzig's experiences in the Franco-Prussian War (1870-1871): the case of Joseph Masseau. J Hist Neurosci. 2010;21(3):250–62. - PubMed
-
- Penfield W, Boldrey E. Somatic motor and sensory representation in the cerebral cortex of man as studied by electrical stimulation. Brain. 1937;60(4):389–443.
-
- Dum RP, Strick PL. Motor areas in the frontal lobe of the primate. Physiol Behav. 2002;77(4-5):677–82. - PubMed
-
- Bruce CJ, Goldberg ME, Bushnell MC, Stanton GB. Primate frontal eye fields. II. Physiological and anatomical correlates of electrically evoked eye movements. J Neurophysiol. 1985;54(3):714–34. - PubMed
-
- Bonini L, Maranesi M, Livi A, Fogassi L, Rizzolatti G. Ventral premotor neurons encoding representations of action during self and others' inaction. Curr Biol. 2014;24(14):1611–4. - PubMed
Publication types
MeSH terms
Grants and funding
LinkOut - more resources
Full Text Sources
Other Literature Sources
