

Does High-Dose Antimicrobial Chemotherapy Prevent the Evolution of Resistance?
- PMID: 26820986
- PMCID: PMC4731197
- DOI: 10.1371/journal.pcbi.1004689
Does High-Dose Antimicrobial Chemotherapy Prevent the Evolution of Resistance?
Abstract
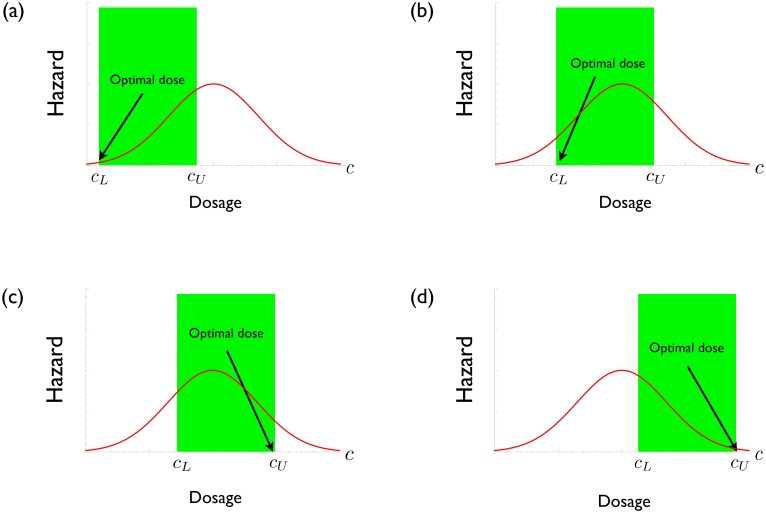
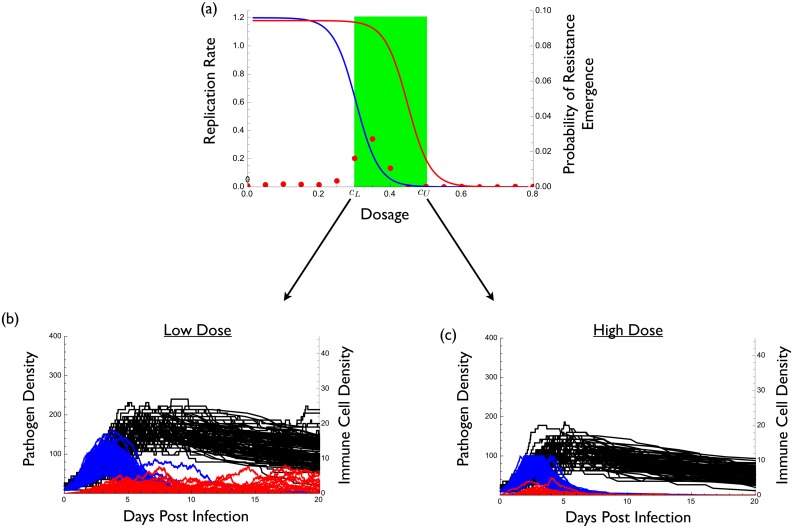
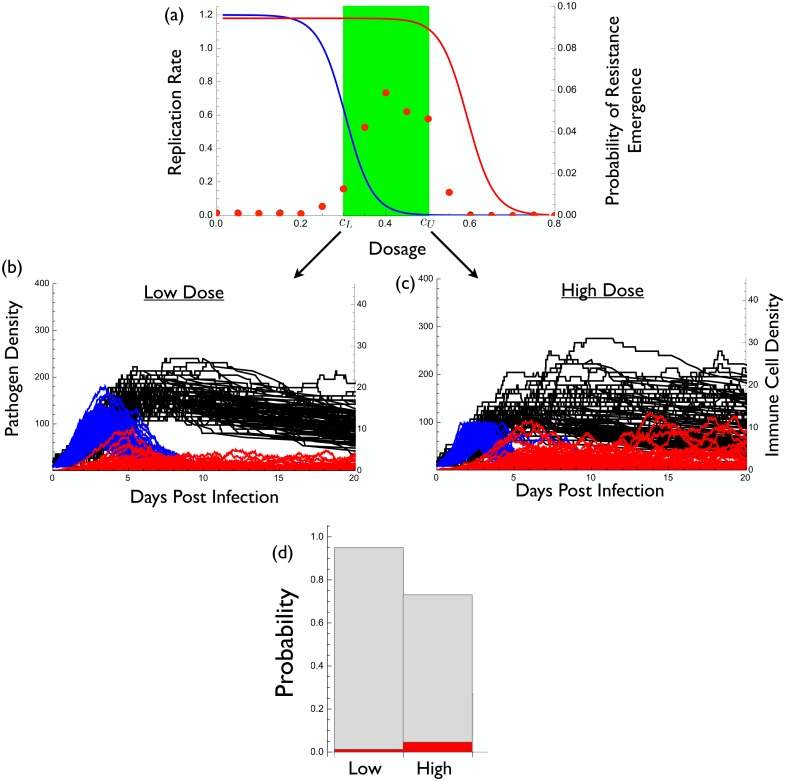
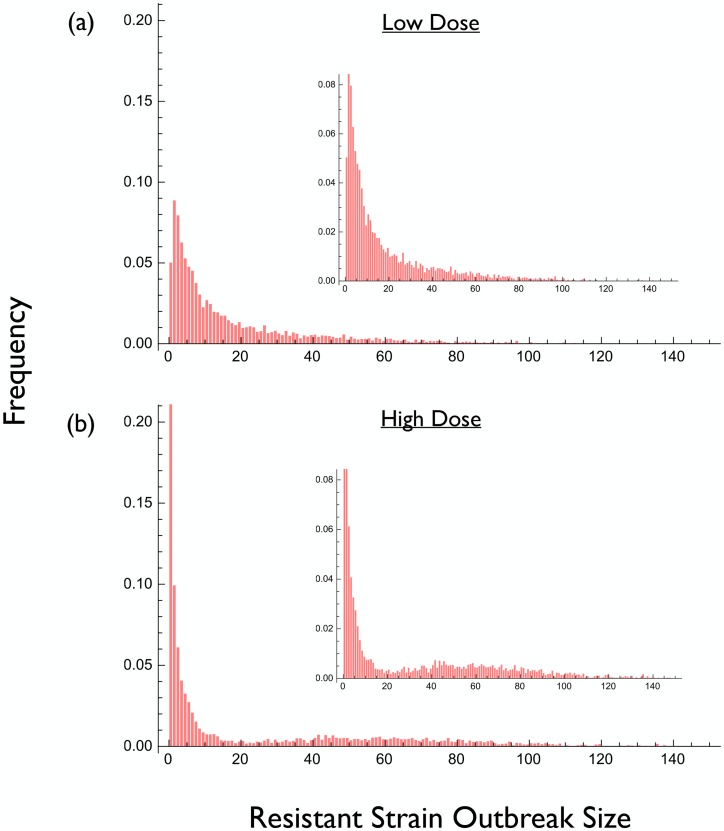
High-dose chemotherapy has long been advocated as a means of controlling drug resistance in infectious diseases but recent empirical studies have begun to challenge this view. We develop a very general framework for modeling and understanding resistance emergence based on principles from evolutionary biology. We use this framework to show how high-dose chemotherapy engenders opposing evolutionary processes involving the mutational input of resistant strains and their release from ecological competition. Whether such therapy provides the best approach for controlling resistance therefore depends on the relative strengths of these processes. These opposing processes typically lead to a unimodal relationship between drug pressure and resistance emergence. As a result, the optimal drug dose lies at either end of the therapeutic window of clinically acceptable concentrations. We illustrate our findings with a simple model that shows how a seemingly minor change in parameter values can alter the outcome from one where high-dose chemotherapy is optimal to one where using the smallest clinically effective dose is best. A review of the available empirical evidence provides broad support for these general conclusions. Our analysis opens up treatment options not currently considered as resistance management strategies, and it also simplifies the experiments required to determine the drug doses which best retard resistance emergence in patients.
Conflict of interest statement
The authors have declared that no competing interests exist.
Figures
Similar articles
-
Aggressive or moderate drug therapy for infectious diseases? Trade-offs between different treatment goals at the individual and population levels.PLoS Comput Biol. 2019 Aug 12;15(8):e1007223. doi: 10.1371/journal.pcbi.1007223. eCollection 2019 Aug. PLoS Comput Biol. 2019. PMID: 31404059 Free PMC article.
-
Using combination therapy to thwart drug resistance.Future Microbiol. 2015;10(11):1719-26. doi: 10.2217/fmb.15.68. Future Microbiol. 2015. PMID: 26597425 Review.
-
Efflux as a mechanism of antimicrobial drug resistance in clinical relevant microorganisms: the role of efflux inhibitors.Expert Opin Ther Targets. 2017 Jan;21(1):23-36. doi: 10.1080/14728222.2017.1265105. Epub 2016 Dec 5. Expert Opin Ther Targets. 2017. PMID: 27892739 Review.
-
Countering drug resistance, infectious diseases, and sepsis using metal and metal oxides nanoparticles: Current status.Colloids Surf B Biointerfaces. 2016 Oct 1;146:70-83. doi: 10.1016/j.colsurfb.2016.05.046. Epub 2016 May 18. Colloids Surf B Biointerfaces. 2016. PMID: 27259161 Review.
-
The challenge of resistance in antimicrobial drug development.Future Microbiol. 2015;10(11):1709-10. doi: 10.2217/fmb.15.75. Future Microbiol. 2015. PMID: 26597424 Free PMC article. No abstract available.
Cited by
-
Cooperation among cancer cells: applying game theory to cancer.Nat Rev Cancer. 2019 Feb;19(2):110-117. doi: 10.1038/s41568-018-0083-7. Nat Rev Cancer. 2019. PMID: 30470829 Free PMC article. Review.
-
Treatment timing shifts the benefits of short and long antibiotic treatment over infection.Evol Med Public Health. 2020 Nov 23;2020(1):249-263. doi: 10.1093/emph/eoaa033. eCollection 2020. Evol Med Public Health. 2020. PMID: 33376597 Free PMC article.
-
Using ecological coexistence theory to understand antibiotic resistance and microbial competition.Nat Ecol Evol. 2021 Apr;5(4):431-441. doi: 10.1038/s41559-020-01385-w. Epub 2021 Feb 1. Nat Ecol Evol. 2021. PMID: 33526890 Review.
-
Suppression of bacteriocin resistance using live, heterospecific competitors.Evol Appl. 2019 May 3;12(6):1191-1200. doi: 10.1111/eva.12797. eCollection 2019 Jun. Evol Appl. 2019. PMID: 31293631 Free PMC article.
-
Evolutionary epidemiology models to predict the dynamics of antibiotic resistance.Evol Appl. 2019 Jan 21;12(3):365-383. doi: 10.1111/eva.12753. eCollection 2019 Mar. Evol Appl. 2019. PMID: 30828361 Free PMC article.
References
-
- Ehrlich P. Chemotherapeutics: Scientific principles, methods, and results. The Lancet. 1913;182:445–451.
-
- Fleming A. Penicillin. Nobel lectures, physiology or medicine 1942–1962. Elsevier Publishing Company, Amsterdam; 1964.
-
- Roberts JA, Kruger P, Paterson DL, Lipman J. Antibiotic resistance: what’s dosing got to do with it? Critical Care Medicine. 2008;36:2433–2440. - PubMed
-
- Abdul-Aziz MH, Lipman J, Mouton JW, Hope WW, Roberts JA. Applying pharmacokinetic/pharmacodynamic principles in critically ill patients: Optimizing efficacy and reducing resistance development. Seminars in Respiratory and Critical Care Medicine. 2015;36:136–153. 10.1055/s-0034-1398490 - DOI - PubMed
Publication types
MeSH terms
Substances
LinkOut - more resources
Full Text Sources
Other Literature Sources
Research Materials
