

Stochastic neutral modelling of the Gut Microbiota's relative species abundance from next generation sequencing data
- PMID: 26821617
- PMCID: PMC4959352
- DOI: 10.1186/s12859-015-0858-8
Stochastic neutral modelling of the Gut Microbiota's relative species abundance from next generation sequencing data
Abstract
Background: Interest in understanding the mechanisms that lead to a particular composition of the Gut Microbiota is highly increasing, due to the relationship between this ecosystem and the host health state. Particularly relevant is the study of the Relative Species Abundance (RSA) distribution, that is a component of biodiversity and measures the number of species having a given number of individuals. It is the universal behaviour of RSA that induced many ecologists to look for theoretical explanations. In particular, a simple stochastic neutral model was proposed by Volkov et al. relying on population dynamics and was proved to fit the coral-reefs and rain forests RSA. Our aim is to ascertain if this model also describes the Microbiota RSA and if it can help in explaining the Microbiota plasticity.
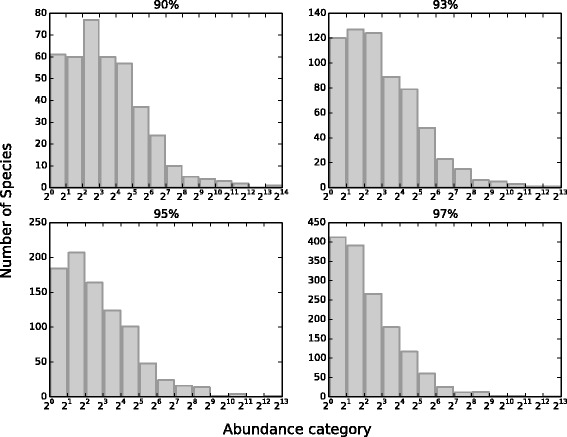
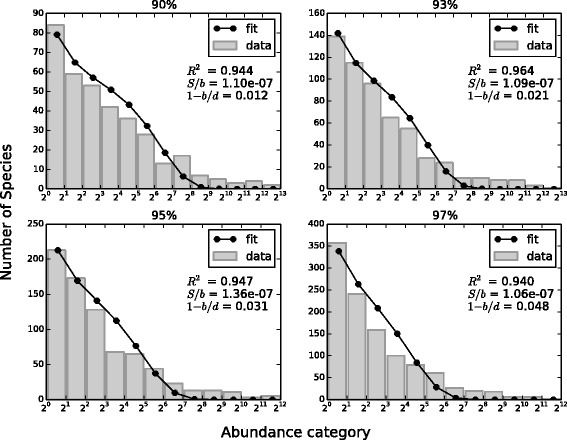
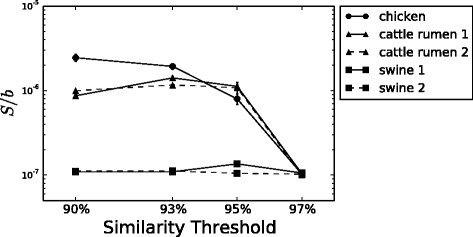
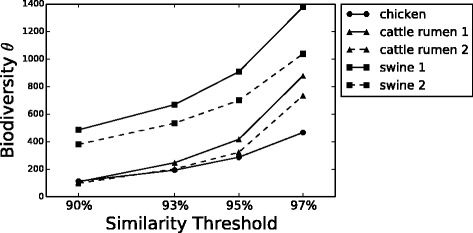
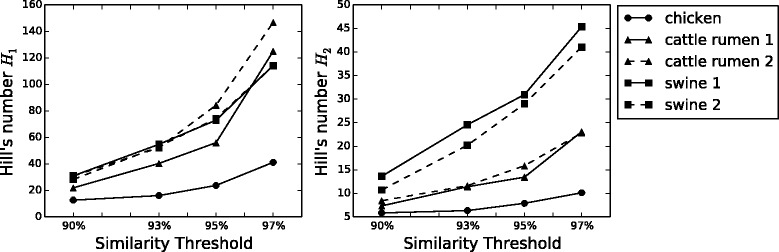
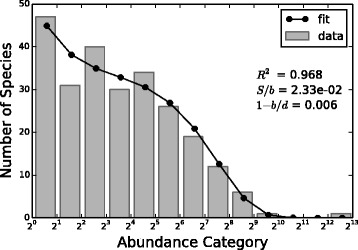
Results: We analyzed 16S rRNA sequencing data sampled from the Microbiota of three different animal species by Jeraldo et al. Through a clustering procedure (UCLUST), we built the Operational Taxonomic Units. These correspond to bacterial species considered at a given phylogenetic level defined by the similarity threshold used in the clustering procedure. The RSAs, plotted in the form of Preston plot, were fitted with Volkov's model. The model fits well the Microbiota RSA, except in the tail region, that shows a deviation from the neutrality assumption. Looking at the model parameters we were able to discriminate between different animal species, giving also a biological explanation. Moreover, the biodiversity estimator obtained by Volkov's model also differentiates the animal species and is in good agreement with the first and second order Hill's numbers, that are common evenness indexes simply based on the fraction of individuals per species.
Conclusions: We conclude that the neutrality assumption is a good approximation for the Microbiota dynamics and the observation that Volkov's model works for this ecosystem is a further proof of the RSA universality. Moreover, the ability to separate different animals with the model parameters and biodiversity number are promising results if we think about future applications on human data, in which the Microbiota composition and biodiversity are in close relationships with a variety of diseases and life-styles.
Figures
Similar articles
-
Longitudinal study of the early-life fecal and nasal microbiotas of the domestic pig.BMC Microbiol. 2015 Sep 21;15(1):184. doi: 10.1186/s12866-015-0512-7. BMC Microbiol. 2015. PMID: 26391877 Free PMC article.
-
Comparative analysis of gut microbial community in healthy and tibial dyschondroplasia affected chickens by high throughput sequencing.Microb Pathog. 2018 May;118:133-139. doi: 10.1016/j.micpath.2018.03.001. Epub 2018 Mar 16. Microb Pathog. 2018. PMID: 29555507
-
A comparison of sequencing platforms and bioinformatics pipelines for compositional analysis of the gut microbiome.BMC Microbiol. 2017 Sep 13;17(1):194. doi: 10.1186/s12866-017-1101-8. BMC Microbiol. 2017. PMID: 28903732 Free PMC article.
-
The pig gut microbial diversity: Understanding the pig gut microbial ecology through the next generation high throughput sequencing.Vet Microbiol. 2015 Jun 12;177(3-4):242-51. doi: 10.1016/j.vetmic.2015.03.014. Epub 2015 Mar 23. Vet Microbiol. 2015. PMID: 25843944 Review.
-
Repertoire of human gut microbes.Microb Pathog. 2017 May;106:103-112. doi: 10.1016/j.micpath.2016.06.020. Epub 2016 Jun 16. Microb Pathog. 2017. PMID: 27317857 Review.
Cited by
-
Statistical analysis of co-occurrence patterns in microbial presence-absence datasets.PLoS One. 2017 Nov 16;12(11):e0187132. doi: 10.1371/journal.pone.0187132. eCollection 2017. PLoS One. 2017. PMID: 29145425 Free PMC article.
-
Gut microbiota ecology: Biodiversity estimated from hybrid neutral-niche model increases with health status and aging.PLoS One. 2020 Oct 30;15(10):e0237207. doi: 10.1371/journal.pone.0237207. eCollection 2020. PLoS One. 2020. PMID: 33125392 Free PMC article.
-
Neutrality in the Metaorganism.PLoS Biol. 2019 Jun 19;17(6):e3000298. doi: 10.1371/journal.pbio.3000298. eCollection 2019 Jun. PLoS Biol. 2019. PMID: 31216282 Free PMC article.
-
Stochastic colonization of hosts with a finite lifespan can drive individual host microbes out of equilibrium.PLoS Comput Biol. 2020 Nov 2;16(11):e1008392. doi: 10.1371/journal.pcbi.1008392. eCollection 2020 Nov. PLoS Comput Biol. 2020. PMID: 33137114 Free PMC article.
-
Comparison between 16S rRNA and shotgun sequencing data for the taxonomic characterization of the gut microbiota.Sci Rep. 2021 Feb 4;11(1):3030. doi: 10.1038/s41598-021-82726-y. Sci Rep. 2021. PMID: 33542369 Free PMC article.
References
Publication types
MeSH terms
Substances
LinkOut - more resources
Full Text Sources
Other Literature Sources
