

Histone H3K36 methylation regulates pre-mRNA splicing in Saccharomyces cerevisiae
- PMID: 26821844
- PMCID: PMC4841608
- DOI: 10.1080/15476286.2016.1144009
Histone H3K36 methylation regulates pre-mRNA splicing in Saccharomyces cerevisiae
Abstract
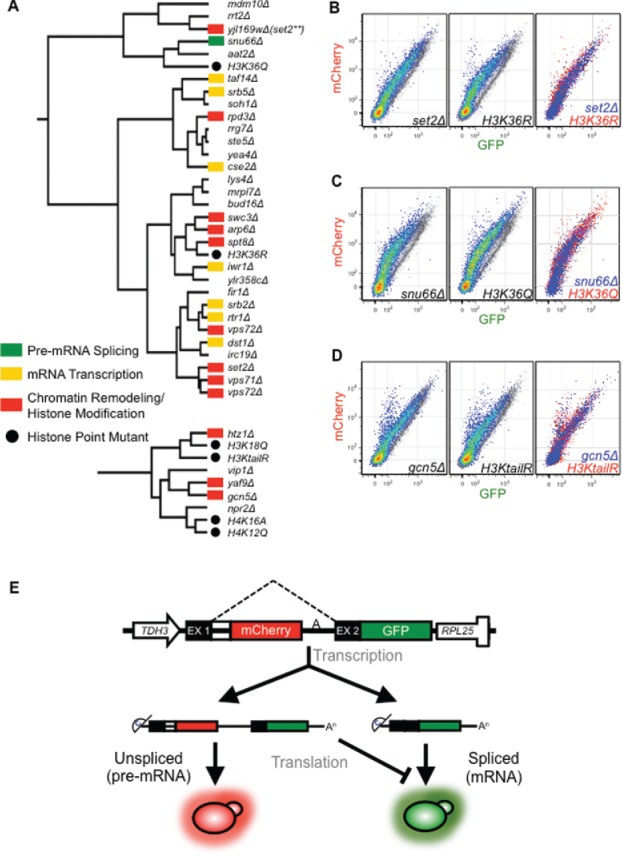
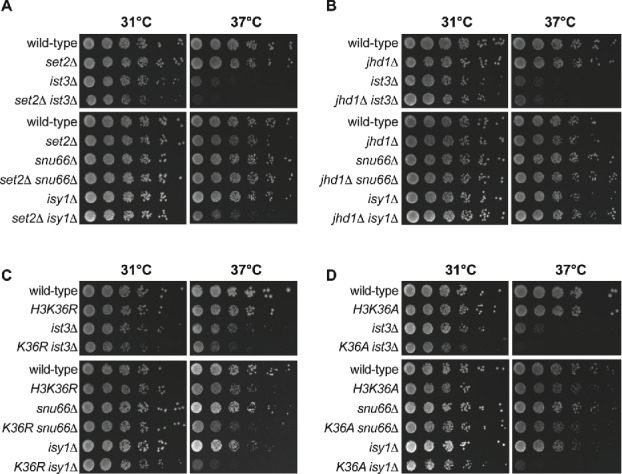
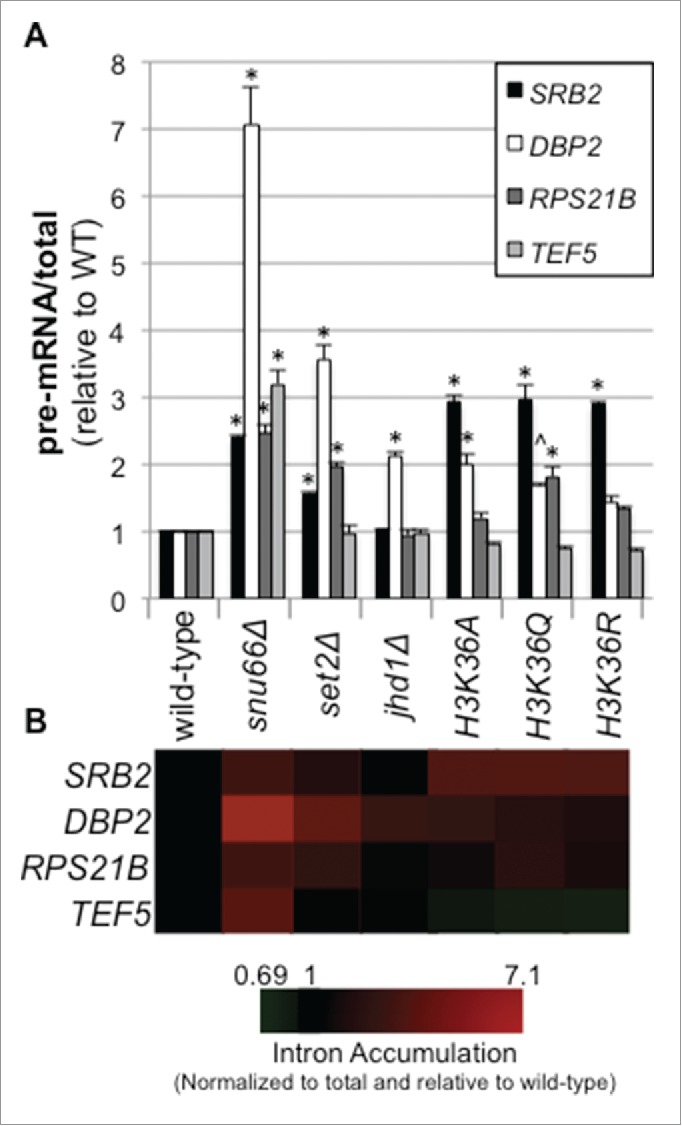
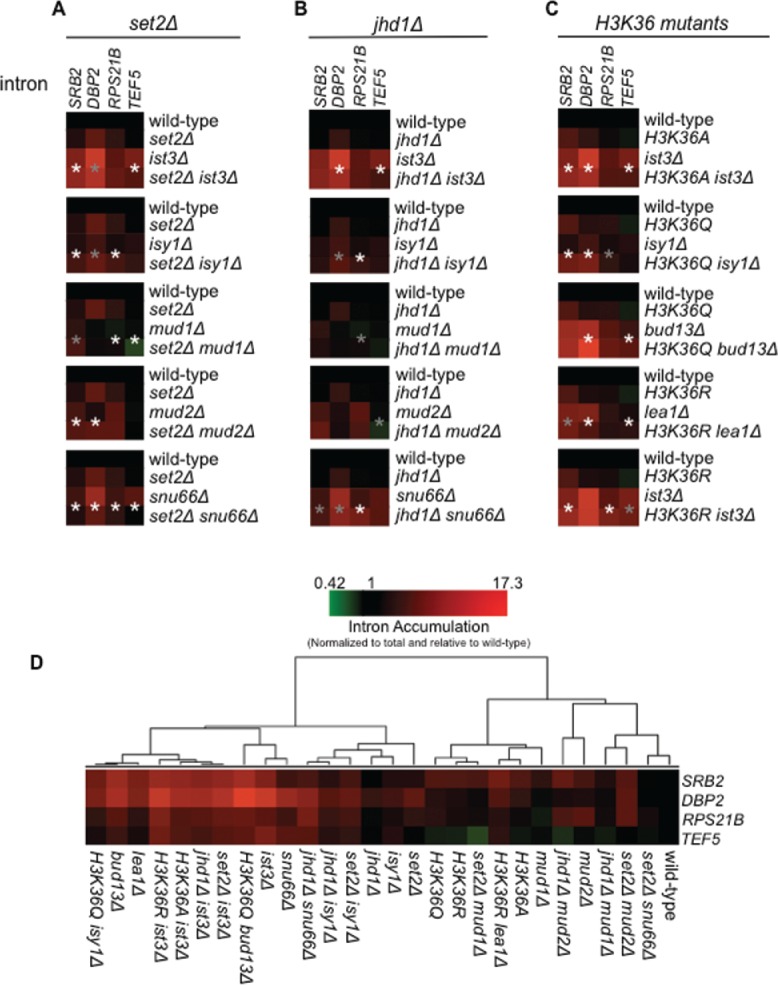
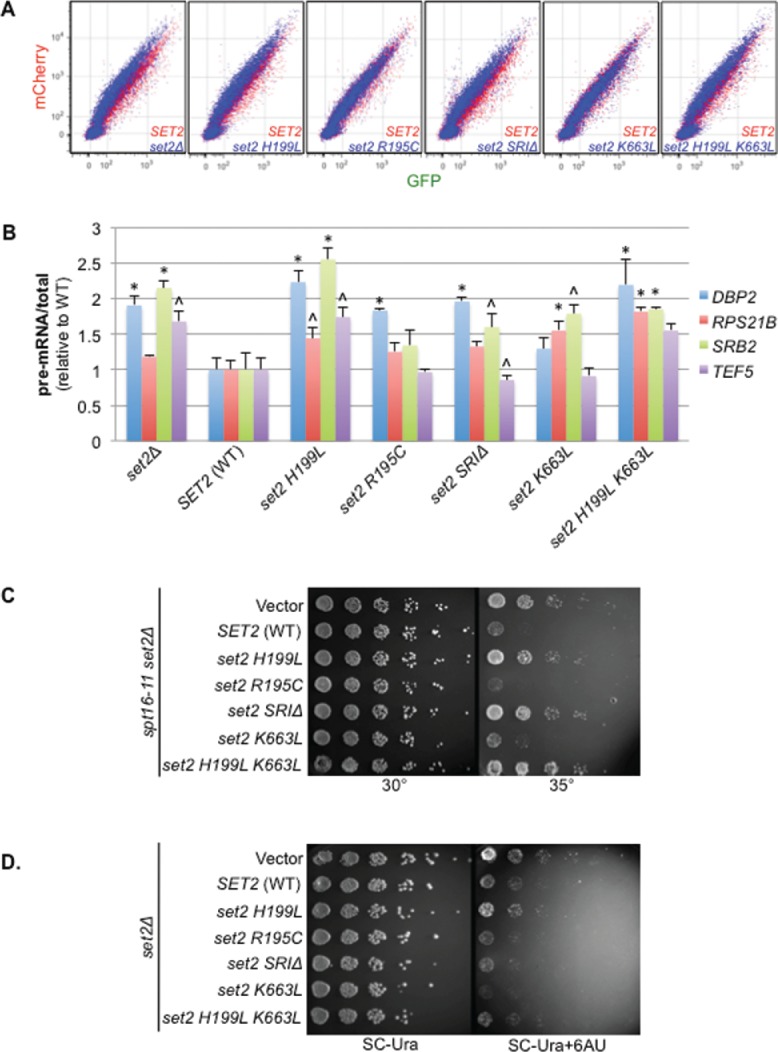
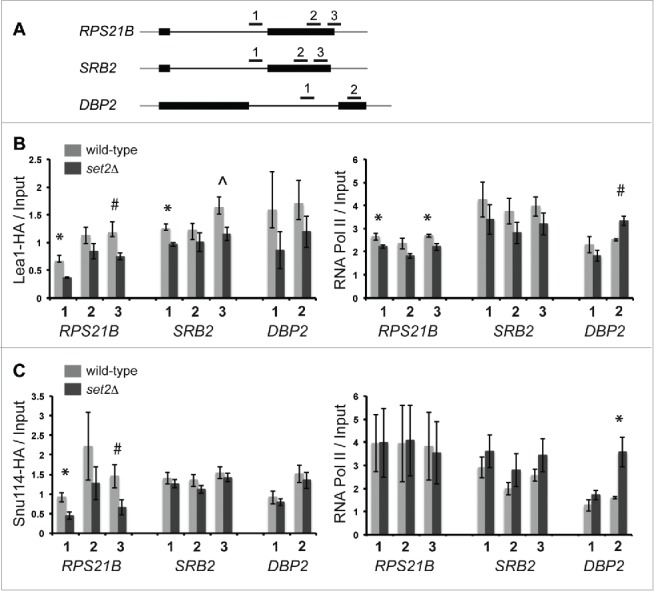
Co-transcriptional splicing takes place in the context of a highly dynamic chromatin architecture, yet the role of chromatin restructuring in coordinating transcription with RNA splicing has not been fully resolved. To further define the contribution of histone modifications to pre-mRNA splicing in Saccharomyces cerevisiae, we probed a library of histone point mutants using a reporter to monitor pre-mRNA splicing. We found that mutation of H3 lysine 36 (H3K36) - a residue methylated by Set2 during transcription elongation - exhibited phenotypes similar to those of pre-mRNA splicing mutants. We identified genetic interactions between genes encoding RNA splicing factors and genes encoding the H3K36 methyltransferase Set2 and the demethylase Jhd1 as well as point mutations of H3K36 that block methylation. Consistent with the genetic interactions, deletion of SET2, mutations modifying the catalytic activity of Set2 or H3K36 point mutations significantly altered expression of our reporter and reduced splicing of endogenous introns. These effects were dependent on the association of Set2 with RNA polymerase II and H3K36 dimethylation. Additionally, we found that deletion of SET2 reduces the association of the U2 and U5 snRNPs with chromatin. Thus, our study provides the first evidence that H3K36 methylation plays a role in co-transcriptional RNA splicing in yeast.
Keywords: Chromatin; co-transcriptional pre-mRNA splicing; coupling; histones; methylation; snRNPs; transcription.
Figures
Similar articles
-
A conserved genetic interaction between Spt6 and Set2 regulates H3K36 methylation.Nucleic Acids Res. 2019 May 7;47(8):3888-3903. doi: 10.1093/nar/gkz119. Nucleic Acids Res. 2019. PMID: 30793188 Free PMC article.
-
H3K36 Methylation and the Chromodomain Protein Eaf3 Are Required for Proper Cotranscriptional Spliceosome Assembly.Cell Rep. 2019 Jun 25;27(13):3760-3769.e4. doi: 10.1016/j.celrep.2019.05.100. Cell Rep. 2019. PMID: 31242410 Free PMC article.
-
A novel domain in Set2 mediates RNA polymerase II interaction and couples histone H3 K36 methylation with transcript elongation.Mol Cell Biol. 2005 Apr;25(8):3305-16. doi: 10.1128/MCB.25.8.3305-3316.2005. Mol Cell Biol. 2005. PMID: 15798214 Free PMC article.
-
Shaping the cellular landscape with Set2/SETD2 methylation.Cell Mol Life Sci. 2017 Sep;74(18):3317-3334. doi: 10.1007/s00018-017-2517-x. Epub 2017 Apr 6. Cell Mol Life Sci. 2017. PMID: 28386724 Free PMC article. Review.
-
A site to remember: H3K36 methylation a mark for histone deacetylation.Mutat Res. 2007 May 1;618(1-2):130-4. doi: 10.1016/j.mrfmmm.2006.08.014. Epub 2007 Jan 21. Mutat Res. 2007. PMID: 17346757 Review.
Cited by
-
The conserved elongation factor Spn1 is required for normal transcription, histone modifications, and splicing in Saccharomyces cerevisiae.Nucleic Acids Res. 2020 Oct 9;48(18):10241-10258. doi: 10.1093/nar/gkaa745. Nucleic Acids Res. 2020. PMID: 32941642 Free PMC article.
-
Genome-wide Kdm4 histone demethylase transcriptional regulation in Drosophila.Mol Genet Genomics. 2019 Oct;294(5):1107-1121. doi: 10.1007/s00438-019-01561-z. Epub 2019 Apr 24. Mol Genet Genomics. 2019. PMID: 31020413 Free PMC article.
-
A conserved genetic interaction between Spt6 and Set2 regulates H3K36 methylation.Nucleic Acids Res. 2019 May 7;47(8):3888-3903. doi: 10.1093/nar/gkz119. Nucleic Acids Res. 2019. PMID: 30793188 Free PMC article.
-
The ATP-dependent chromatin remodeler Chd1 is recruited by transcription elongation factors and maintains H3K4me3/H3K36me3 domains at actively transcribed and spliced genes.Nucleic Acids Res. 2017 Jul 7;45(12):7180-7190. doi: 10.1093/nar/gkx321. Nucleic Acids Res. 2017. PMID: 28460001 Free PMC article.
-
Histone Methylation Is Required for Virulence, Conidiation, and Multi-Stress Resistance of Alternaria alternata.Front Microbiol. 2022 Jun 16;13:924476. doi: 10.3389/fmicb.2022.924476. eCollection 2022. Front Microbiol. 2022. PMID: 35783406 Free PMC article.
References
-
- Wahl MC, Will CL, Luhrmann R. The spliceosome: Design principles of a dynamic RNP machine. Cell 2009; 136:701-18; PMID:19239890; http://dx.doi.org/ 10.1016/j.cell.2009.02.009 - DOI - PubMed
-
- Carrillo Oesterreich F, Preibisch S, Neugebauer KM. Global analysis of nascent RNA reveals transcriptional pausing in terminal exons. Mol Cell 2010; 40:571-81; PMID:21095587; http://dx.doi.org/ 10.1016/j.molcel.2010.11.004 - DOI - PubMed
-
- Churchman LS, Weissman JS. Nascent transcript sequencing visualizes transcription at nucleotide resolution. Nature 2011; 469:368-73; PMID:21248844; http://dx.doi.org/ 10.1038/nature09652 - DOI - PMC - PubMed
-
- Alexander RD, Innocente SA, Barrass JD, Beggs JD. Splicing-dependent RNA polymerase pausing in yeast. Mol Cell 2010; 40:582-93; PMID:21095588; http://dx.doi.org/ 10.1016/j.molcel.2010.11.005 - DOI - PMC - PubMed
-
- Kotovic KM, Lockshon D, Boric L, Neugebauer KM. Cotranscriptional recruitment of the U1 snRNP to intron-containing genes in yeast. Mol Cell Biol 2003; 23:5768-79; PMID:12897147; http://dx.doi.org/ 10.1128/MCB.23.16.5768-5779.2003 - DOI - PMC - PubMed
Publication types
MeSH terms
Substances
Grants and funding
LinkOut - more resources
Full Text Sources
Other Literature Sources
Molecular Biology Databases