. 2016 Jan 28:14:14.
doi: 10.1186/s12916-016-0557-y.

Heterogeneous dynamics, robustness/fragility trade-offs, and the eradication of the macroparasitic disease, lymphatic filariasis

Affiliations

Heterogeneous dynamics, robustness/fragility trade-offs, and the eradication of the macroparasitic disease, lymphatic filariasis

Edwin Michael et al. BMC Med. .

Abstract

Background: The current WHO-led initiative to eradicate the macroparasitic disease, lymphatic filariasis (LF), based on single-dose annual mass drug administration (MDA) represents one of the largest health programs devised to reduce the burden of tropical diseases. However, despite the advances made in instituting large-scale MDA programs in affected countries, a challenge to meeting the goal of global eradication is the heterogeneous transmission of LF across endemic regions, and the impact that such complexity may have on the effort required to interrupt transmission in all socioecological settings.

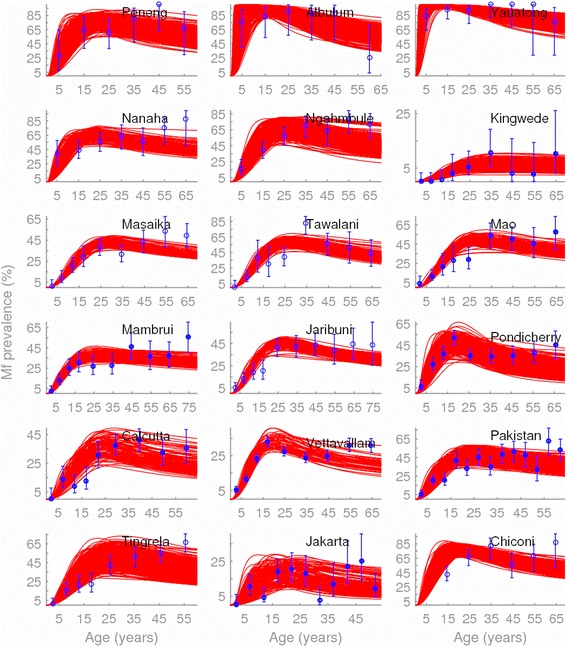
Methods: Here, we apply a Bayesian computer simulation procedure to fit transmission models of LF to field data assembled from 18 sites across the major LF endemic regions of Africa, Asia and Papua New Guinea, reflecting different ecological and vector characteristics, to investigate the impacts and implications of transmission heterogeneity and complexity on filarial infection dynamics, system robustness and control.

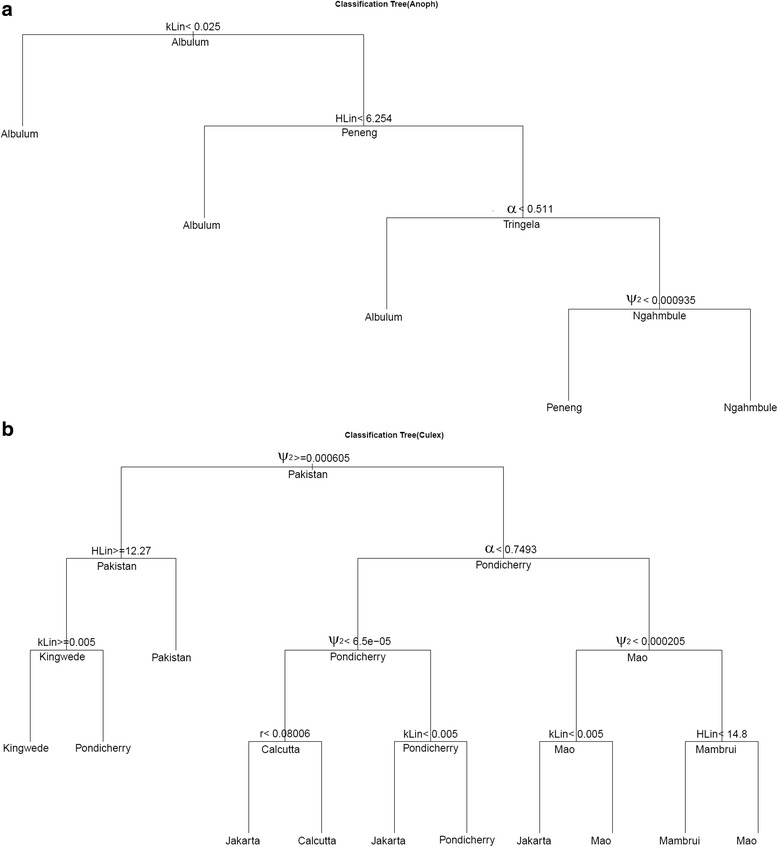
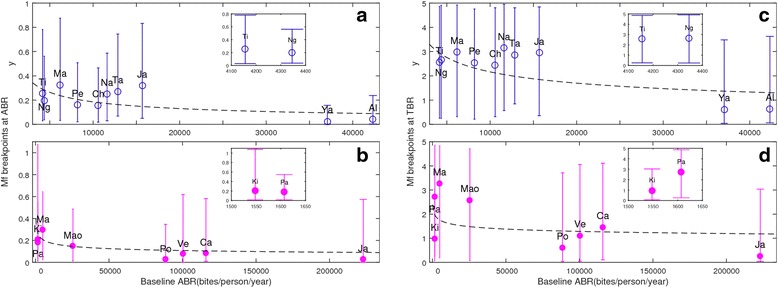
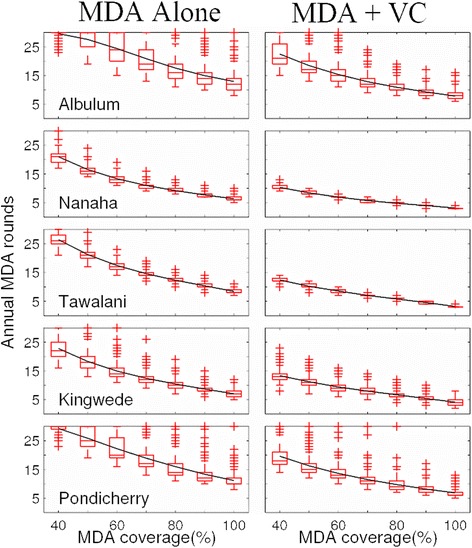
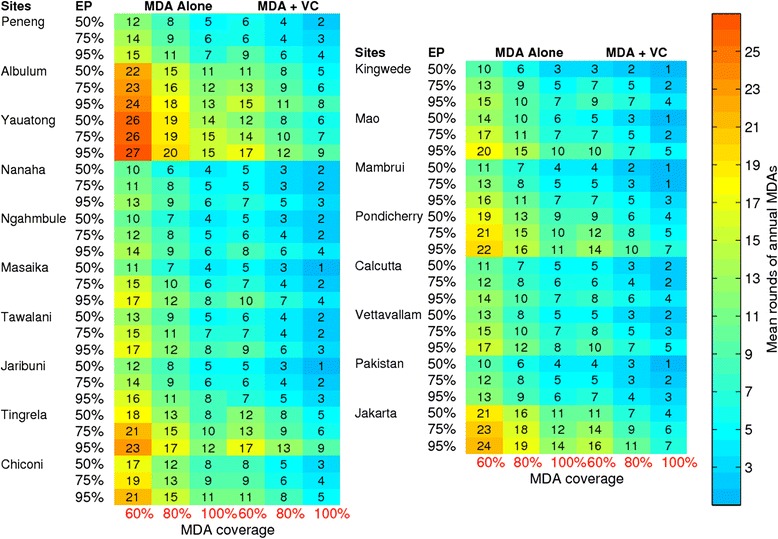
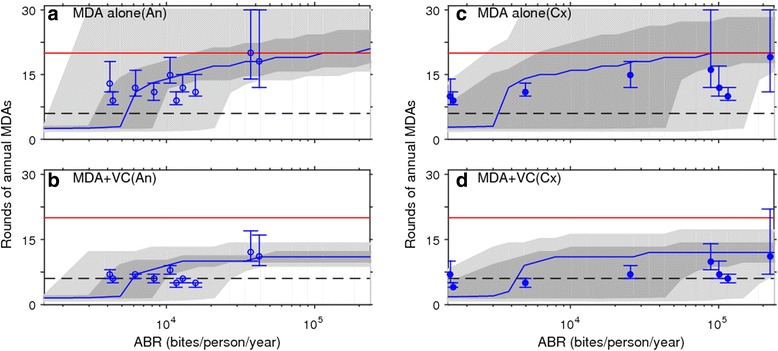
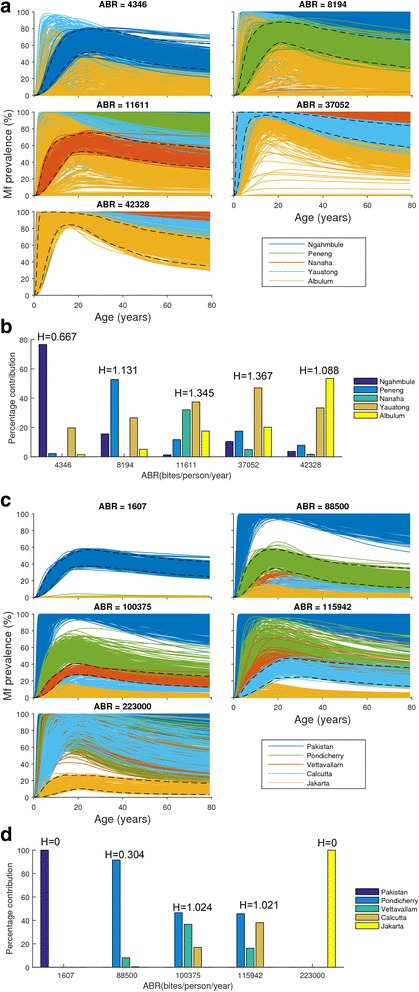
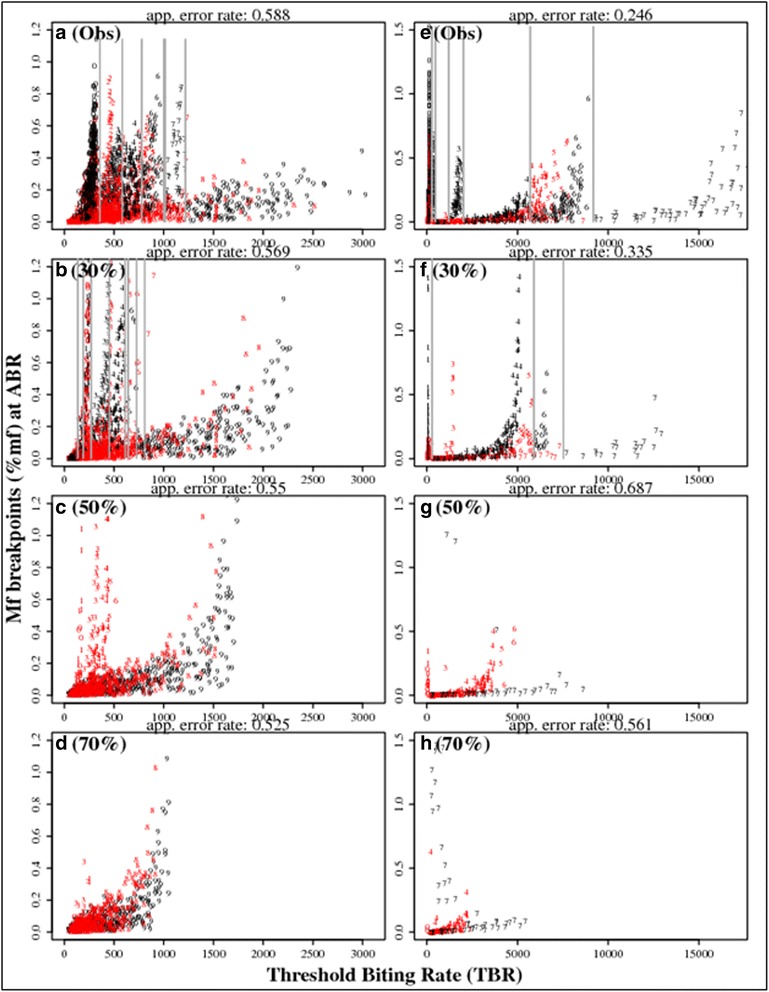
Results: We find firstly that LF elimination thresholds varied significantly between the 18 study communities owing to site variations in transmission and initial ecological parameters. We highlight how this variation in thresholds lead to the need for applying variable durations of interventions across endemic communities for achieving LF elimination; however, a major new result is the finding that filarial population responses to interventions ultimately reflect outcomes of interplays between dynamics and the biological architectures and processes that generate robustness/fragility trade-offs in parasite transmission. Intervention simulations carried out in this study further show how understanding these factors is also key to the design of options that would effectively eliminate LF from all settings. In this regard, we find how including vector control into MDA programs may not only offer a countermeasure that will reliably increase system fragility globally across all settings and hence provide a control option robust to differential locality-specific transmission dynamics, but by simultaneously reducing transmission regime variability also permit more reliable macroscopic predictions of intervention effects.

Conclusions: Our results imply that a new approach, combining adaptive modelling of parasite transmission with the use of biological robustness as a design principle, is required if we are to both enhance understanding of complex parasitic infections and delineate options to facilitate their elimination effectively.


Figures

Fig. 1
Fig. 1
Observed and fitted microfilarial age-prevalences of lymphatic filariasis (LF) for each study site. The SIR BM model fits (red lines) to observed baseline mf prevalences in different age-groups (blue circles with binomial error-bars) from the 18 study sites investigated in this work are shown; the filled circles display the data for the culicine communities, while the open circles denote data for the anopheline communities. The age-groups are represented by the mid-point of the groups studied in each community. The study sites and details of survey data are described in Table 1. All mf prevalence values were standardized to reflect sampling of 1 ml blood volumes using a transformation factor of 1.95 and 1.15, respectively, for values originally estimated using 20 or 100 μl blood volumes [49]
Fig. 2
Fig. 2
Classification tree analysis to identify model parameters that differed significantly between the present study sites. (a) Anopheles mosquitoes and (b) Culex mosquitoes. The fitted trees, stratified by mosquito species, indicate that local between-site variation in the LF infection age-patterns observed between the present study sites depended only on a few “stiff” combinations of parameters. These parameters are the HLin, a threshold value used to adjust the rate at which individuals of age a are bitten, worm establishment rate (ψ2), degree of community infection aggregation (k) and worm fecundity rate (α) in both culicine (Cx) and anopheline (An) systems, and additionally the term, r, related to mf uptake by mosquitoes in the anopheline system. The classification trees were fitted using the rpart package in R
Fig. 3
Fig. 3
Mf breakpoints as a function of baseline community annual biting rate (ABR) and microfilaria (mf) prevalence. The mf breakpoints estimated in each site are shown as average values with 95 % CIs, calculated as the 2.5th and 97.5th percentiles of the breakpoint distribution in each site, and are plotted against the observed ABRs in each site; filled and open circles, respectively, represent values for the culicine and anopheline settings. The data in (a, b) and (c, d), respectively, represent the mf breakpoints estimated at the observed site-specific ABRs and the corresponding estimated threshold biting rates (TBRs). Both types of mf breakpoints were negatively correlated with ABR, with the fitted dashed lines indicating that overall these data follow a power-law function: f(x) = ax b, with x representing the biting rate values on the x-axis, and f(x) the mf breakpoints on the y-axis. The term a is a constant while b is the power-law exponent, with fitted values of (a, b) as follows: (a) (20.54, −0.5112); (b) (1.335, −0.2184); (c) (54.25, −0.3498); and (d) (4.251, −0.104). All four associated p values were <0.01. The set of mf breakpoints plotted in each graph were calculated using the best-fitting parameter vectors obtained from model fits to the baseline mf age-profile of each study site. In the plots, individual sites are indicated by their first two letters, except for “Mao” in the culicine settings, in order to distinguish it from “Ma” used for “Mambrui”. Inset plots are provided to clarify the variations in the breakpoint values estimated for sites with approximately the same baseline ABR values, which were obscured in the respective main plots
Fig. 4
Fig. 4
Variability in the impact of annual mass drug administration (MDA) and combined MDA plus vector control (VC) on intervention rounds in years required to eliminate LF in different endemic communities (results shown for selected study sites). The required annual MDA rounds without and with VC as a function of drug coverage (from 40 % to 100 %) are shown as box plots, with the solid horizontal line depicting the means. Supplemental use of vector control (VC) was modelled at 80 % coverage. The results are shown for mf breakpoint threshold values representing a 95 % elimination probability (see Table 3). The results for the remaining study sites are shown in Additional file 1: Figure S4 and S5. These results are from the model simulations carried out for both LF intervention scenarios using the site-specific parameter vectors that best-fitted baseline age-prevalence infection in each site (compare with Fig. 1)
Fig. 5
Fig. 5
Mean rounds of annual MDAs in years predicted for achieving LF elimination as a joint function of the community-level baseline mf prevalence and breakpoint thresholds at 95 % EP. (a) MDA alone and (b) MDA + VC. Blue symbols, culicine sites; tan symbols, anopheline sites. EP, elimination probability; MDA, mass drug administration; VC, vector control
Fig. 6
Fig. 6
Mean rounds of annual MDAs in years for achieving LF elimination in each study site. The left and right heat maps are, respectively, for the anopheline and culicine settings. Two intervention scenarios (namely, MDA alone and MDA + VC, with VC coverage at 80 %) were modeled using three mf breakpoint threshold values at 50 %, 75 % and 95 % elimination probabilities (see Table 3). The results are shown for three MDA coverages at 60 %, 80 % and 100 % for the MDA alone in the first three columns and for the MDA + VC strategy in the remaining three columns of both the left- and right-panel plots. The drug regimens and their respective efficacies (i.e. adult worm and mf killing rates and efficacious period) used in modeling these intervention scenarios are given in Table 1. The mean number of years of interventions were derived using model runs for each of the 18 study sites based on their site-specific best-fit parameter vectors. EP, elimination probability; MDA, mass drug administration; VC, vector control
Fig. 7
Fig. 7
Site-specific versus macroscopic superensemble predictions of the impact of LF interventions. The results from combining site-specific best-fit model parameters to develop and use vector-specific superensemble models for simulating the impact of LF intervention at 80 % MDA and VC coverages for the MDA alone and MDA + VC strategies are shown in (a, c) and (b, d), respectively. The solid curves represent the superensemble medians of annual MDA rounds required to reduce community-level mf prevalences below their respective infection breakpoint thresholds for achieving a 95 % probability of elimination, and are stratified as a function of community ABR (annual biting rate) values. Note that the x-axis is on a logarithmic scale. The dark and light grey regions, respectively, represent the 50 % (between the 25th and 75th percentiles) and 95 % (between the 2.5th and 97.5th percentiles) credible intervals (CIs) of the number of years of interventions predicted by the ensemble model to cross the respective 95 % elimination thresholds in each site. Circles (open, anopheline sites; filled, culicine sites) denote the median number of years of each intervention (at 80 % coverages) predicted by the respective best-fitting site-specific models to break LF transmission. The lower dashed line drawn at 6 years (i.e. the time period representing six annual MDA rounds) is to contrast the model-predicted MDA rounds required to achieve LF elimination with the WHO recommendation of applying six annual MDAs to achieve elimination of LF from all endemic settings in the world. The upper solid line drawn at 20 annual MDA cycles represents the target deadline for meeting the call for eliminating LF worldwide by 2020. The results for each site represent simulations of the impact of interventions mimicking a start year of 2000 (i.e. the year of WHO announcement of GPELF) and maintenance of MDA and VC coverages at 80 % throughout
Fig. 8
Fig. 8
Contribution of site-specific parameter vectors to predictions of the superensemble model. The simulation of mf age-prevalence curves at endemic equilibrium by the vector-specific LF regional superensemble model (see text) given the baseline ABR of each study site are portrayed for each of five PNG anopheline (a, b) and five Southeast Asian culicine (c, d) study settings. The curves represent the sets of mf age-prevalence curves, individually color-coded, generated by the resultant S (=5) site-specific parameter vectors comprising the respective regional model in each site. In each site, we count the number n i of the best-fit parameter vectors (belonging to the ith site-specific set of the superensemble) that are able to reproduce the observed mf age-prevalence in each site (i.e. fall within the 2.5th and 97.5th percentiles (shown by the dashed curves) of the site-specific mf age-prevalence data), in order to quantify the proportional contributions (i.e. niN where N = ∑n i) of individual members, S, of the global model to each site-specific prediction. The Shannon index, H=i=1SniNlnniN was used to measure the diversity in the superensemble parameter vectors as a result of the relative contributions of these S members to each regional prediction, with a higher diversity index denoting a greater contribution of site-specific parameter vectors arising from different study settings to the regional prediction of infection in a site. The bars in the grouped-bar plots in (b, d) depict the percentage contribution (i.e. niN×100 of each S site-specific parameter member to the regional ensemble model predictions of age-infection in each of the anopheline (b) and culicine (d) settings, with the values of the corresponding Shannon index (H) displayed overhead
Fig. 9
Fig. 9
The impact of reducing ABR by VC on LF transmission regimes. The recursive partitioning of LF elimination regimes was obtained by carrying out a classification analysis using the kalR package in R on mf breakpoint values obtained at different ABR values changing from baseline due to reductions brought about by VC. The left-side panel of plots (a to d) portray the results for the anopheline (An) superensemble whereas the right-side panel (e to h) show results for the culicine (Cx) global model. Mf breakpoints depicted in each panel plot were calculated at the observed baseline ABR values (a(Obs) and e(Obs)) and at reduced ABR values per site as follows: 30 % reduction (b, f); 50 % (c, g); and 70 % (d, h). As the baseline ABR values in each site are reduced from 0 % (no reduction) to 30 %, different regimes of breakpoints signifying initially separable or partitionable site-specific values as indicated by the vertical lines begin to shrink in terms of their ranges. Further reductions (of 50 % and 70 %) in the baseline ABRs lead to a collapse of these different regimes into a single regime at the 70 % reduction stage

Similar articles

Cited by

References

    1. Ottesen EA, Hooper PJ, Bradley M, Biswas G. The global programme to eliminate lymphatic filariasis: health impact after 8 years. PLoS Negl Trop Dis. 2008;2(10):e317. doi: 10.1371/journal.pntd.0000317. - DOI - PMC - PubMed
    1. Rebollo MP, Bockarie MJ. Toward the elimination of lymphatic filariasis by 2020: treatment update and impact assessment for the endgame. Expert Rev Anti Infect Ther. 2013;11(7):723–31. doi: 10.1586/14787210.2013.811841. - DOI - PubMed
    1. Michael E, Bundy DA, Grenfell BT. Re-assessing the global prevalence and distribution of lymphatic filariasis. Parasitology. 1996;112(Pt 4):409–28. doi: 10.1017/S0031182000066646. - DOI - PubMed
    1. Michael E, Bundy DA. Global mapping of lymphatic filariasis. Parasitol Today. 1997;13(12):472–6. doi: 10.1016/S0169-4758(97)01151-4. - DOI - PubMed
    1. Slater H, Michael E. Predicting the current and future potential distributions of lymphatic filariasis in Africa using maximum entropy ecological niche modelling. PLoS One. 2012;7(2):e32202. doi: 10.1371/journal.pone.0032202. - DOI - PMC - PubMed

Publication types

MeSH terms

LinkOut - more resources