. 2016 Jan 29:7:10370.
doi: 10.1038/ncomms10370.

Arrhythmogenesis in Timothy Syndrome is associated with defects in Ca(2+)-dependent inactivation

Affiliations

Arrhythmogenesis in Timothy Syndrome is associated with defects in Ca(2+)-dependent inactivation

Ivy E Dick et al. Nat Commun. .

Abstract

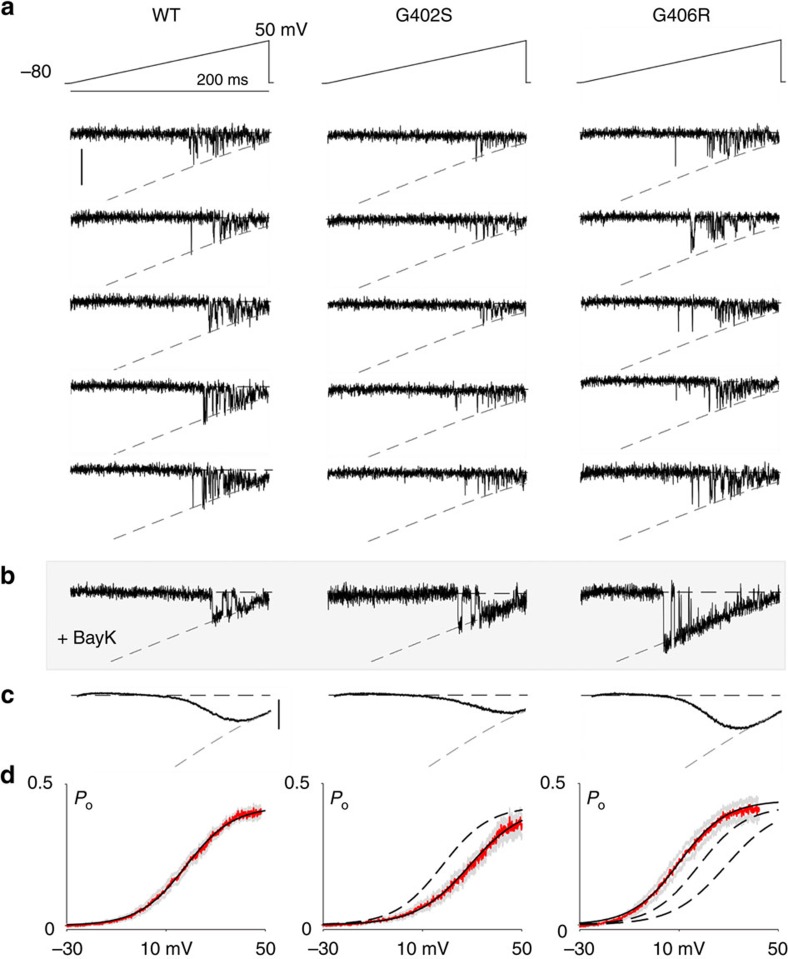
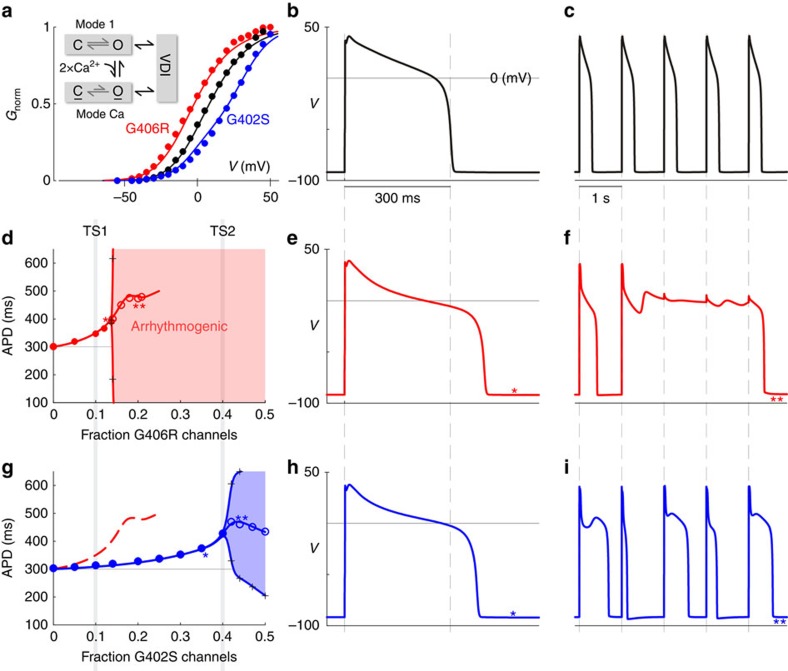
Timothy Syndrome (TS) is a multisystem disorder, prominently featuring cardiac action potential prolongation with paroxysms of life-threatening arrhythmias. The underlying defect is a single de novo missense mutation in CaV1.2 channels, either G406R or G402S. Notably, these mutations are often viewed as equivalent, as they produce comparable defects in voltage-dependent inactivation and cause similar manifestations in patients. Yet, their effects on calcium-dependent inactivation (CDI) have remained uncertain. Here, we find a significant defect in CDI in TS channels, and uncover a remarkable divergence in the underlying mechanism for G406R versus G402S variants. Moreover, expression of these TS channels in cultured adult guinea pig myocytes, combined with a quantitative ventricular myocyte model, reveals a threshold behaviour in the induction of arrhythmias due to TS channel expression, suggesting an important therapeutic principle: a small shift in the complement of mutant versus wild-type channels may confer significant clinical improvement.


Figures

Figure 1
Figure 1. Timothy Syndrome mutations reduce CDI.
(a) Diagram of Timothy Syndrome mutations within human CaV1.2. Exon 8 is expected to be paired with exon 1a in cardiac channels. (b) Exemplar whole-cell current traces in Ca2+ (red) and Ba2+ (black). CDI is seen as the faster decay of the Ca2+ versus Ba2+ trace. Channels are co-expressed with β2a to allow examination of CDI independent of VDI effects. In addition to their VDI effects, both Timothy Syndrome mutations confer a significant decrease in CDI (middle, right). Scale bars are 200 pA and refer to the Ca2+ trace. (c). Population data, the fraction of peak current remaining after 300-ms depolarization (r300) is plotted for Ba2+ and Ca2+ currents. The difference between Ca2+ and Ba2+ relations at 30 mV (f300) specifies the isolated effect of CDI. Error bars represent±s.e.m., n=10, 8 and 12 for WT, G402S and G406R, respectively.
Figure 2
Figure 2. An allosteric model could explain a decrease in CDI.
(a) An allosteric CDI mechanism. Ca2+ (black circles) binding to CaM (green) drives channels into mode Ca, which exhibits lower open probability (PO). (b) The model predicts two main components of CDI. FCDI (blue) is the fraction of channels in mode Ca (dependent on J(Ca2+) and thus PO) and CDImax (green) results from the relative ability of the channel to open once in mode Ca. The combination of these two curves defines the total CDI of a channel (black). (c) Mutations which inhibit channel opening (ΔΔGa>0) decrease Ca2+ entry, reducing FCDI (blue). These channels will exhibit lower CDI (black) due to a decreased ability to populate mode Ca. (d) Alternatively, enhanced channel opening (ΔΔGa<0), increases openings in mode Ca, thereby decreasing CDImax (green) and overall CDI (black).
Figure 3
Figure 3. Opposing shifts in channel activation in TS channels.
(a) Exemplar on-cell current recordings in response to a voltage ramp (top). Channel openings are fit by the GHK equation (grey dashed line). Scale bar, 1 pA. (b) Addition of Bay K 8644 increases mode 2 openings, verifying channel number and GHK fit. (c) Current averaged over multiple patches gives the current voltage relation (black). The grey dashed relation is now the GHK relation scaled down by PO/max. Scale bar, 0.2 pA. (d) PO as a function of voltage, averaged across cells (red) with Boltzmann fit (black). Grey displays ±s.e.m. G402S (middle) is clearly right shifted (case 1) compared with WT displayed as dashed line for comparison. G406R (right) shifts left (case 2) as compared with WT and G402S (dashed curves). n=13, 8 and 7 for WT, G402S and G406R, respectively.
Figure 4
Figure 4. Controlling the Ca2+ input reveals opposing mechanisms behind TS variants.
(a) Ca2+ uncaging in CaV1.2 (E736A). Channels exhibit little inactivation with lithium as the charge carrier (black). Alexa568 and Fluo-4FF calcium dyes were dialyzed into cells, allowing simultaneous Ca2+ measurement (red). Internal Ca2+ was caged with DMNP-EDTA, allowing a step release of Ca2+ upon UV flash (cyan). Below, CDI is seen as a strong decrease in current (black) compared with pre-flash current (grey). Scale bar, 200 pA. (b) Lower levels of Ca2+ were achieved by varying the Ca2+ cage and UV flash intensity. (c) UV flash data obtained with CaM1234 yields the extent of residual Ca2+ pore block. (d) Fraction block produced by UV flash as a function of Ca2+ concentration for CaV1.2/CaM (black). Grey relation shows the residual pore block from CaM1234 experiments. Error bars indicate±s.e.m. (e) The true CDI curve corrected for residual pore block. The curve for G402S (middle) is remarkably similar to WT CaV1.2 (left), resulting in a nearly identical CDImax (red dashed line) while the CDImax of G406R is significantly reduced (right panel, red dashed line).
Figure 5
Figure 5. Effects of opposing mechanisms on modelled action potentials.
(a) The LRd model was used to gauge TS mutation effects on cardiac ventricular APs. Model activation curves (black curve) fit well the tail-current data (black circles). G406R (red) and G402S (blue) curves shifted to match experiments (circles). Inactivation parameters were similarly adjusted. (b) A single WT AP generated by the model. (c) Modelled WT APs displayed on an expanded timebase during 1-Hz pacing to show stability. (d) Severe effects of G406R channels. Variable G406R expression modelled by including a variable fraction of mutant versus WT channels. At first, APD increased monotonically, then become patently unstable before reaching TS2 levels. (e) Significant APD prolongation at ∼15% G406R. Asterisk indicates corresponding data in d. (f) Profound AP prolongation due to arrhythmogenic early after depolarizations at ∼20% G406R. Double asterisk indicates corresponding data point in d. (g) Milder G402S mutation (blue) effects. Significant APD prolongation does not arise until mutant channels reach the anticipated mean of TS2 patients. The G406R curve is reproduced for comparison (dashed red). (h) APD prolongation at ∼40% G402S. Asterisk indicates corresponding data in g. (i) Slight further increase of G402S (∼44%) induces alternans. Double asterisk indicates corresponding data point in g.
Figure 6
Figure 6. Verification of nonlinear threshold behavior in aGPVMs.
(a) aGPVM APs were recorded via a standard optical mapping setup, using the voltage-sensitive fluorescent dye di-4-ANEPPS. (b) Average AP recorded from uninfected aGPVMs. (c) Lentiviral-mediated expression of recombinant WT CaV1.2 channels caused only slight prolongation of the cardiac APs (black trace) compared with control cells (grey, as in b). (d) Variable G406R expression was determined by GFP expression. As in the LRd model, APs (measured at 80% repolarization) initially increased monotonically without appreciable variability (data plotted as mean±s.d.). Upon slight further increase in G406R channels, APs became flagrantly unstable as cells moved past a bifurcation point into a highly arrythmogenic region. (e) Before the bifurcation region, G406R (red) causes significant APD prolongation as compared with control (grey). Asterisk indicates corresponding data point in d. (f) Outright arrhythmia at higher expression levels (red) confirms the LRd model. Double asterisk indicates corresponding data point in d. (g) Significant APD prolongation by G402S (blue) does not arise, even past expression levels corresponding to a bifurcation point for G406R channels (red dashed curve reproduced from d). (h) Low G402S expression (blue) causes only a slight change in action potential shape compared with control (grey). (i) Higher G402S expression fails to induce severe irregularity of responses, confirming the ability of myocytes to withstand a higher load of G402S channels.
Figure 7
Figure 7. TS effects on Ca2+ transient amplitudes.
(a) The LRd model was used to gauge TS mutation effects on Ca2+ transient amplitudes. Data corresponds to the same simulations run in Fig. 5. Increasing the fraction of G406R channels increased the average Ca2+ transient amplitude (red circles). (+) indicates minimum and maximum amplitudes for an individual simulation. (b) Increasing the fraction of G402S channels also increased the average Ca2+ transient amplitude (blue circles) but with a shallower dependence on the fraction of channels.

References

    1. Splawski I. et al.. Severe arrhythmia disorder caused by cardiac L-type calcium channel mutations. Proc. Natl Acad. Sci. USA 102, 8089–8096 (2005) . - PMC - PubMed
    1. Splawski I. et al.. Ca(V)1.2 calcium channel dysfunction causes a multisystem disorder including arrhythmia and autism. Cell 119, 19–31 (2004) . - PubMed
    1. Liao P., Yong T. F., Liang M. C., Yue D. T. & Soong T. W. Splicing for alternative structures of Cav1.2 Ca2+ channels in cardiac and smooth muscles. Cardiovasc. Res. 68, 197–203 (2005) . - PubMed
    1. Liao P. & Soong T. W. CaV1.2 channelopathies: from arrhythmias to autism, bipolar disorder, and immunodeficiency. Pflugers Arch. 460, 353–359 (2010) . - PubMed
    1. Frohler S. et al.. Exome sequencing helped the fine diagnosis of two siblings afflicted with atypical Timothy syndrome (TS2). BMC Med. Genet. 15, 48 (2014) . - PMC - PubMed

Publication types

Supplementary concepts