

Muscle contraction phenotypic analysis enabled by optogenetics reveals functional relationships of sarcomere components in Caenorhabditis elegans
- PMID: 26822332
- PMCID: PMC4731793
- DOI: 10.1038/srep19900
Muscle contraction phenotypic analysis enabled by optogenetics reveals functional relationships of sarcomere components in Caenorhabditis elegans
Abstract
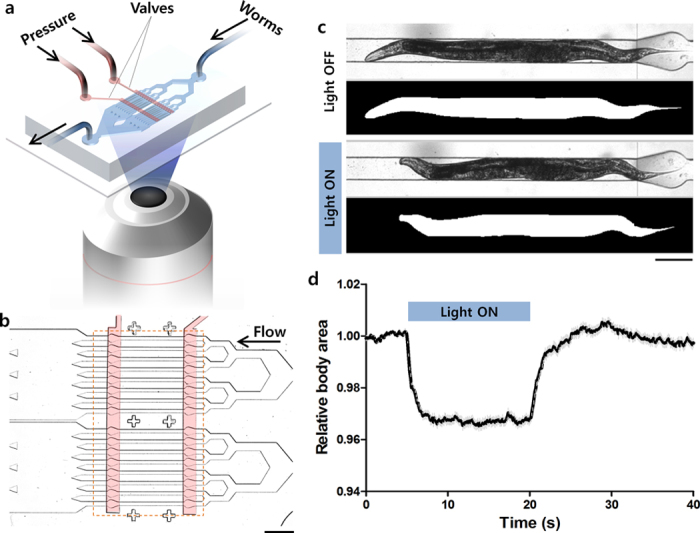
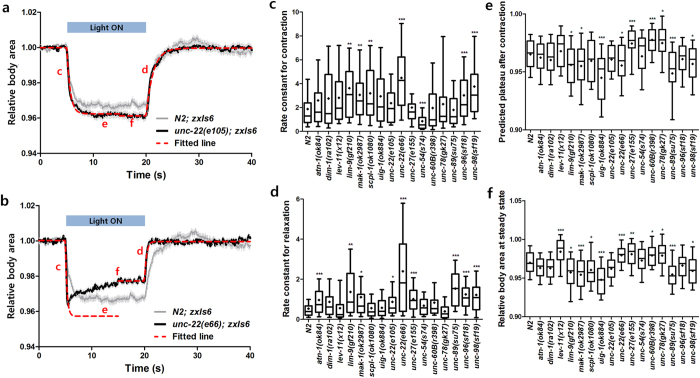
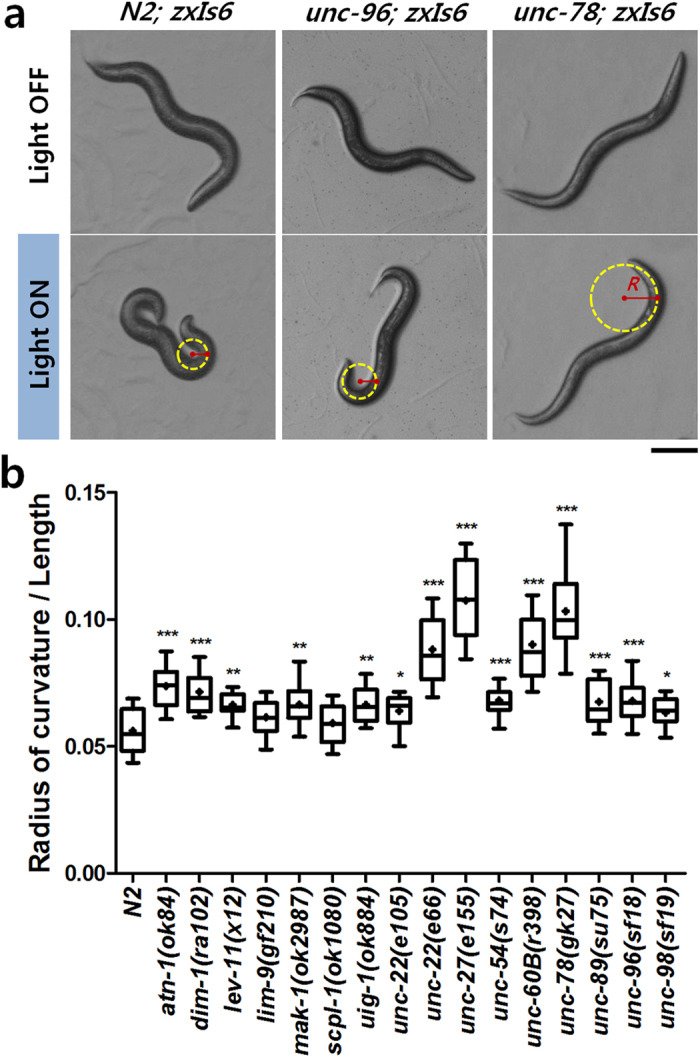
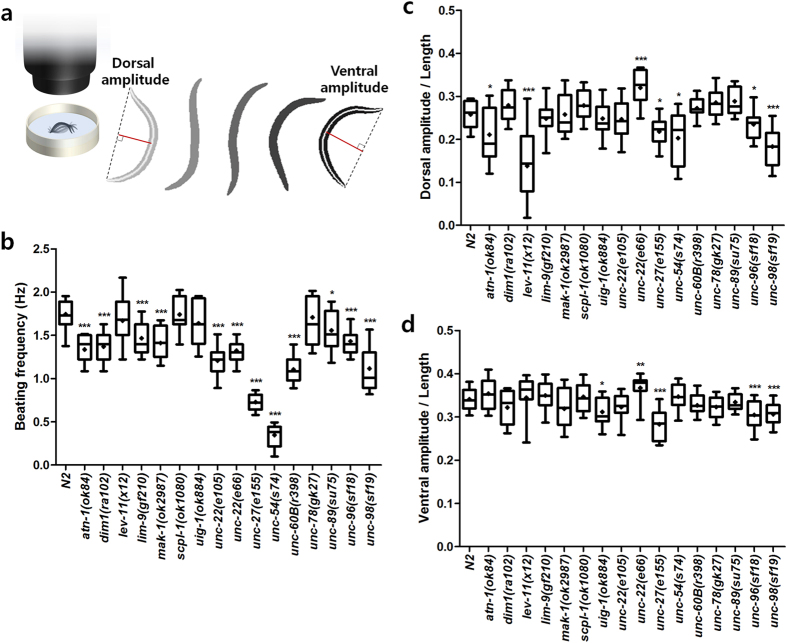
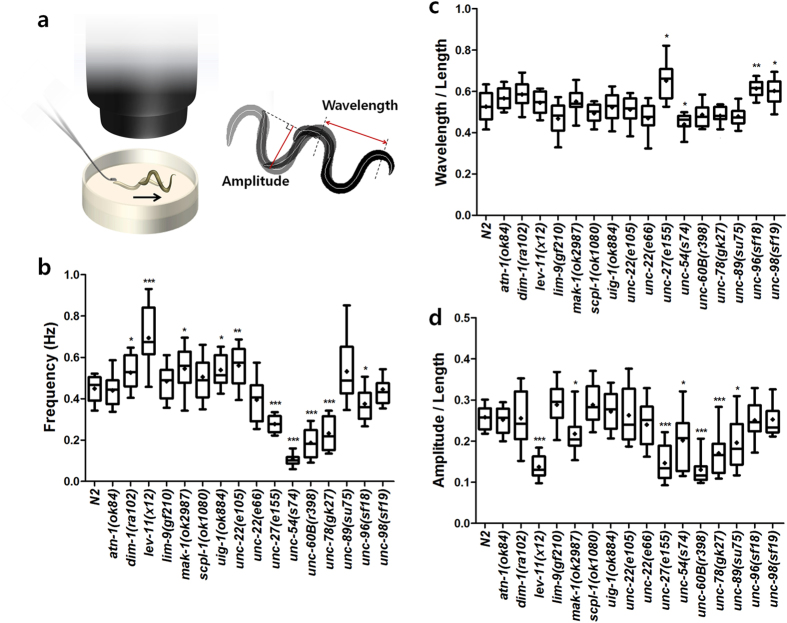
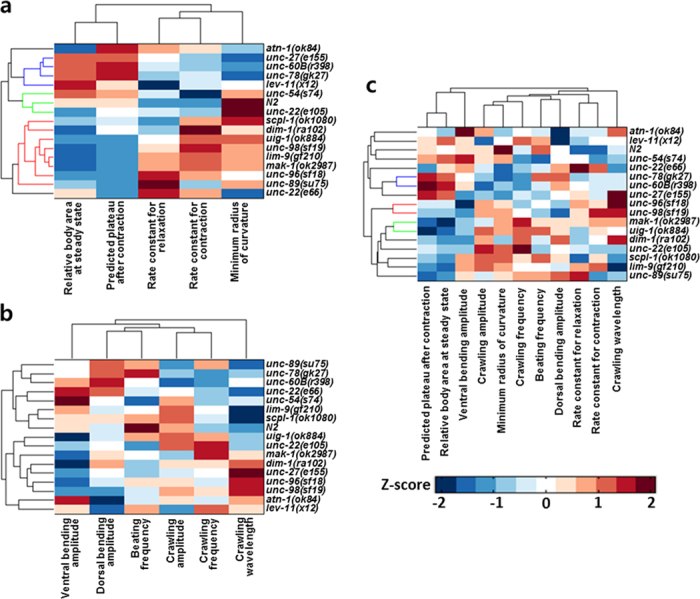
The sarcomere, the fundamental unit of muscle contraction, is a highly-ordered complex of hundreds of proteins. Despite decades of genetics work, the functional relationships and the roles of those sarcomeric proteins in animal behaviors remain unclear. In this paper, we demonstrate that optogenetic activation of the motor neurons that induce muscle contraction can facilitate quantitative studies of muscle kinetics in C. elegans. To increase the throughput of the study, we trapped multiple worms in parallel in a microfluidic device and illuminated for photoactivation of channelrhodopsin-2 to induce contractions in body wall muscles. Using image processing, the change in body size was quantified over time. A total of five parameters including rate constants for contraction and relaxation were extracted from the optogenetic assay as descriptors of sarcomere functions. To potentially relate the genes encoding the sarcomeric proteins functionally, a hierarchical clustering analysis was conducted on the basis of those parameters. Because it assesses physiological output different from conventional assays, this method provides a complement to the phenotypic analysis of C. elegans muscle mutants currently performed in many labs; the clusters may provide new insights and drive new hypotheses for functional relationships among the many sarcomere components.
Figures
Similar articles
-
Development, structure, and maintenance of C. elegans body wall muscle.WormBook. 2017 Apr 13;2017:1-59. doi: 10.1895/wormbook.1.81.2. WormBook. 2017. PMID: 27555356 Free PMC article. Review.
-
Sarcomere assembly in C. elegans muscle.WormBook. 2006 Jan 16:1-16. doi: 10.1895/wormbook.1.81.1. WormBook. 2006. PMID: 18050483 Free PMC article. Review.
-
The Caenorhabditis elegans paxillin orthologue, PXL-1, is required for pharyngeal muscle contraction and for viability.Mol Biol Cell. 2011 Jul 15;22(14):2551-63. doi: 10.1091/mbc.E10-12-0941. Epub 2011 Jun 1. Mol Biol Cell. 2011. PMID: 21633109 Free PMC article.
-
Investigating the correlation of muscle function tests and sarcomere organization in C. elegans.Skelet Muscle. 2021 Aug 13;11(1):20. doi: 10.1186/s13395-021-00275-4. Skelet Muscle. 2021. PMID: 34389048 Free PMC article.
-
Optogenetic manipulation of neural activity in C. elegans: from synapse to circuits and behaviour.Biol Cell. 2013 Jun;105(6):235-50. doi: 10.1111/boc.201200069. Epub 2013 Apr 26. Biol Cell. 2013. PMID: 23458457 Review.
Cited by
-
Optogenetic induction of mechanical muscle stress identifies myosin regulatory ubiquitin ligase NHL-1 in C. elegans.Nat Commun. 2024 Aug 11;15(1):6879. doi: 10.1038/s41467-024-51069-3. Nat Commun. 2024. PMID: 39128917 Free PMC article.
-
NemaFlex: a microfluidics-based technology for standardized measurement of muscular strength of C. elegans.Lab Chip. 2018 Jul 24;18(15):2187-2201. doi: 10.1039/c8lc00103k. Lab Chip. 2018. PMID: 29892747 Free PMC article.
-
Microfluidic Approaches for Manipulating, Imaging, and Screening C. elegans.Micromachines (Basel). 2016 Jul 19;7(7):123. doi: 10.3390/mi7070123. Micromachines (Basel). 2016. PMID: 30404296 Free PMC article. Review.
-
Microfluidic Technologies for High Throughput Screening Through Sorting and On-Chip Culture of C. elegans.Molecules. 2019 Nov 25;24(23):4292. doi: 10.3390/molecules24234292. Molecules. 2019. PMID: 31775328 Free PMC article. Review.
-
Immunolocalization of Disorganized Muscle Protein-1 in Different Life Stages of Human Lymphatic Filariid, Brugia malayi.Acta Parasitol. 2020 Dec;65(4):990-994. doi: 10.2478/s11686-020-00225-y. Epub 2020 Jun 4. Acta Parasitol. 2020. PMID: 32500507 Free PMC article.
References
-
- Epstein H. F., Waterston R. H. & Brenner S. A mutant affecting the heavy chain of myosin in Caenorhabditis elegans. J. Mol. Biol. 90, 291–300 (1974). - PubMed
-
- Moerman D. G., Plurad S., Waterston R. H. & Baillie D. L. Mutations in the unc-54 myosin heavy chain gene of Caenorhabditis elegans that alter contractility but not muscle structure. Cell 29, 773–781 (1982). - PubMed
-
- Bejsovec A. & Anderson P. Myosin heavy-chain mutations that disrupt Caenorhabditis elegans thick filament assembly. Genes Dev. 2, 1307–1317 (1988). - PubMed
-
- Moerman D. G., Benian G. M., Barstead R. J., Schriefer L. A. & Waterston R. H. Identification and intracellular localization of the unc-22 gene product of Caenorhabditis elegans. Genes Dev. 2, 93–105 (1988). - PubMed
-
- Benian G. M., Kiff J. E., Neckelmann N., Moerman D. G. & Waterston R. H. Sequence of an unusually large protein implicated in regulation of myosin activity in C. elegans. Nature 342, 45–50 (1989). - PubMed
Publication types
MeSH terms
Grants and funding
LinkOut - more resources
Full Text Sources
Other Literature Sources
