. 2016 Feb 26;351(6276):933-9.
doi: 10.1126/science.aad0314. Epub 2016 Jan 28.

The maternal interleukin-17a pathway in mice promotes autism-like phenotypes in offspring

Affiliations

The maternal interleukin-17a pathway in mice promotes autism-like phenotypes in offspring

Gloria B Choi et al. Science. .

Abstract

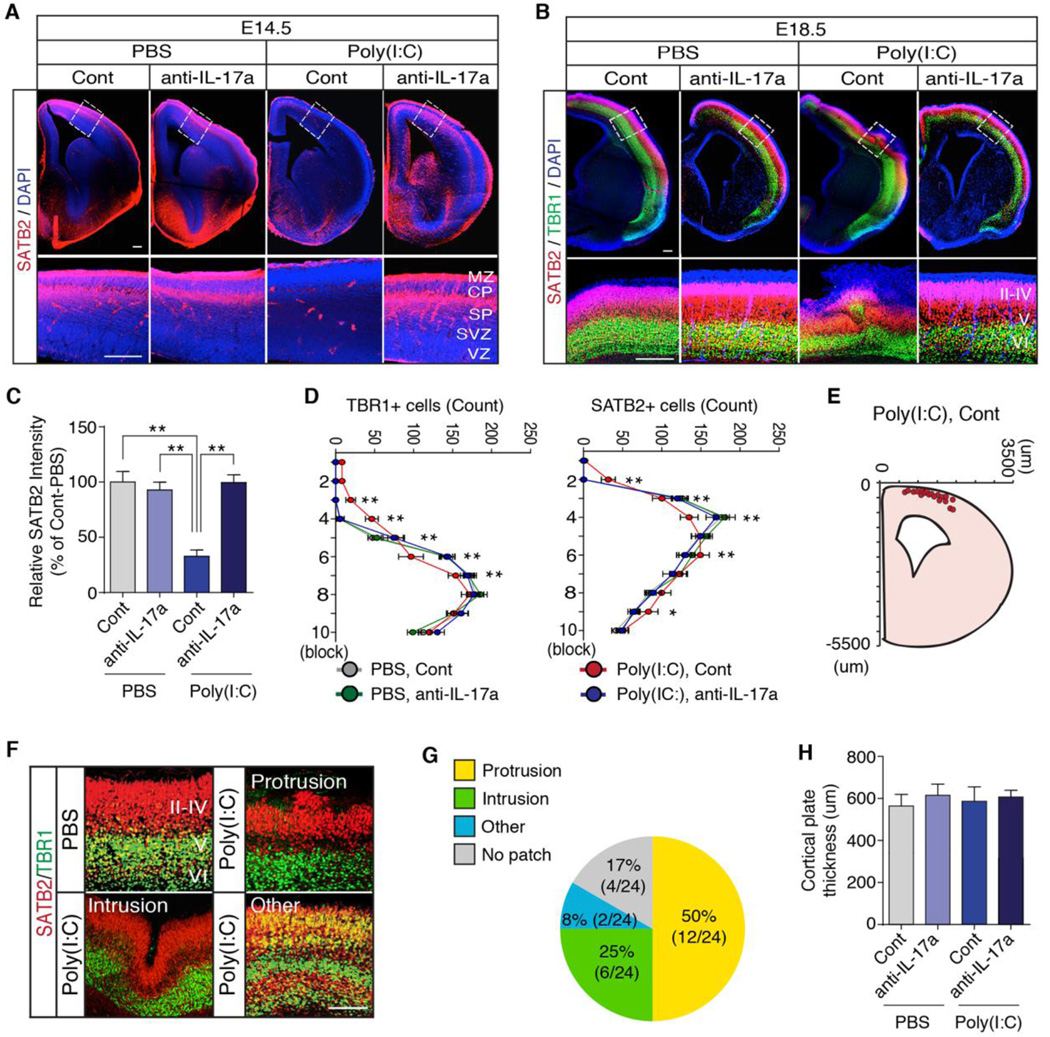
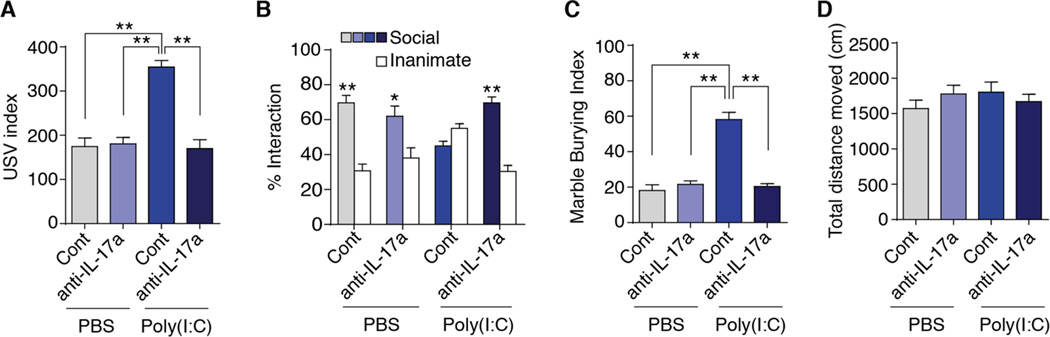
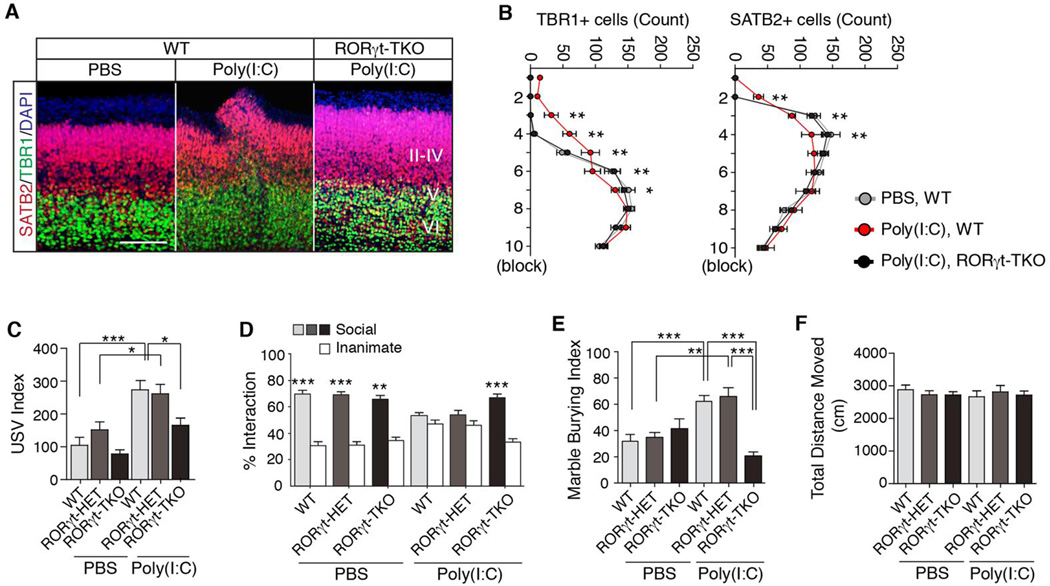
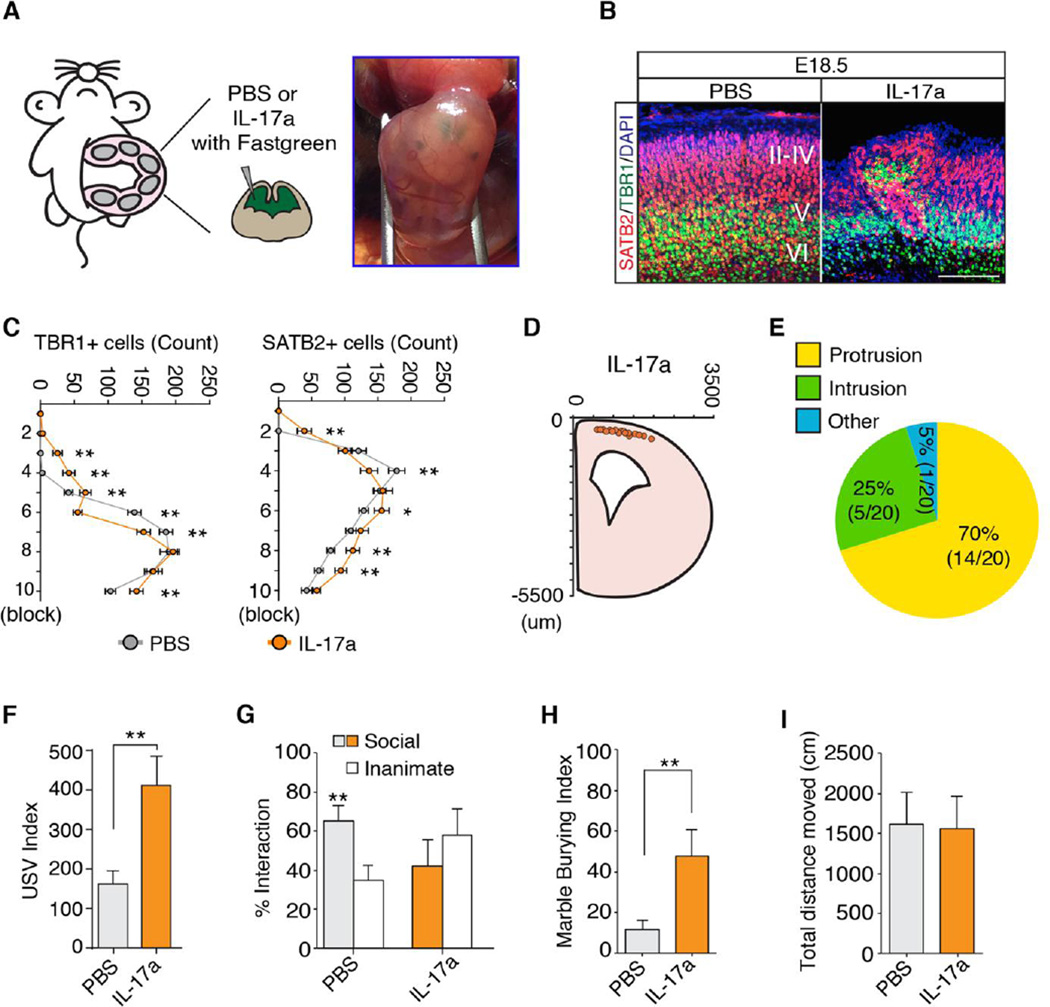
Viral infection during pregnancy has been correlated with increased frequency of autism spectrum disorder (ASD) in offspring. This observation has been modeled in rodents subjected to maternal immune activation (MIA). The immune cell populations critical in the MIA model have not been identified. Using both genetic mutants and blocking antibodies in mice, we show that retinoic acid receptor-related orphan nuclear receptor gamma t (RORγt)-dependent effector T lymphocytes [for example, T helper 17 (TH17) cells] and the effector cytokine interleukin-17a (IL-17a) are required in mothers for MIA-induced behavioral abnormalities in offspring. We find that MIA induces an abnormal cortical phenotype, which is also dependent on maternal IL-17a, in the fetal brain. Our data suggest that therapeutic targeting of TH17 cells in susceptible pregnant mothers may reduce the likelihood of bearing children with inflammation-induced ASD-like phenotypes.


Figures

Fig. 1
Fig. 1. lL-17a increase in mothers subjected to MIA leads to elevated IL-17Ra mRNA expression in the offspring
(A) Serum concentrations of IL-6 (n = 3–5 mice per group, 2 independent experiments) at 3 or 24 hours after PBS or poly(l:C) injection into pregnant dams at E12.5. (B) Serum concentrations of maternal IL-17a (n = 4–8 mice per group, 2 independent experiments) at E14.5 in PBS- or poly(l:C)-injected mothers, pretreated with or without IL-17a blocking antibodies. (C and D) Relative IL-6 (C) and IL-17a (D) mRNA expression in cells isolated from placenta/decidua of PBS- or poly(l:C)-treated mothers at E14.5 and cultured in vitro for 24 hours,. The results are representative of three independent experiments. For each probe set, relative mRNA expression of one biological replicate from PBS-treated dams was set at 1. Real-time PCR analysis of relative expression of indicated genes compared to the level of Gapdh in cells from PBS-treated dams. (E) Supernatant concentrations of IL-17a from ex vivo cultured mononuclear cells, isolated from placenta/decidua of PBS- or poly(l:C)-treated pregnant dams. Stim refers to PMA and lonomycin stimulation. (F and G) Relative IL-17Ra (F) and IL-17Rc (G) mRNA levels in E14.5 male fetal brain, derived from PBS- or Poly(l:C)-injected mothers, pretreated with isotype control (Cont) or IL-17a blocking antibodies (anti-IL-17a). The relative mRNA fold change, compared to the PBS and Cont-treated group, is plotted on the y-axis (n = 7 (PBS, Cont), n = 7 (PBS, anti-IL-17a), n = 7 (Poly(l:C), Cont), n = 7 (Poly(l:C), anti-IL-17a); from 2–3 independent experiments). (H) In situ hybridization with an IL-17Ra RNA probe in E14.5 male fetal brains derived from PBS- or poly(l:C)- injected mothers. Images are representative of four independent experiments. (I) Relative signal intensity for images shown in (H). Scale bar represents 100 µm. (A, B, E, F and G) One-way ANOVA with Tukey post-hoc tests. (C, D and I) Student's t test. **P < 0.01. Graphs show mean ± SEM.
Fig. 2
Fig. 2. The IL-17a pathway promotes abnormal cortical development in the offspring of pregnant dams following MIA
(A) Immuno-fluorescence staining of SATB2 (a marker of postmitotic neurons in superficial cortical layers) in E14.5 male fetal brain, derived from PBS- or poly(l:C)-injected mothers, pretreated with isotype control (Cont) or IL-17a blocking antibodies (anti-IL-17a). (MZ: marginal zone, CP: cortical plate, SP: subplate, SVZ: subventricular zone, VZ: ventricular zone). (B) Staining of SATB2 and TBR1 (a marker restricted to deeper cortical layers) in E18.5 male fetal brains from animals treated as in (A). II–IV, V and VI refer to different cortical layers. (C) Quantification of SATB2 intensity in the cortical plate of E14.5 fetal brains (n = 8 (PBS, Cont), n = 8 (PBS, anti-IL-17a), n = 8 (Poly(l:C), Cont), n = 8 (Poly(l:C), anti-IL-17a), 3 independent experiments). (D) Quantification of TBR1 and SATB2 positive cells in a 300×300 µm2 region of interest (ROI) centered on the malformation in the cortical plate of E18.5 fetal brains (n = 20 (PBS, Cont), n = 20 (PBS, anti-IL-17a), n = 24 (Poly(l:C), Cont), n = 20 (Poly(l:C), anti-IL-17a), 5 independent experiments). (E) The spatial location of the cortical patch in E18.5 male fetal brains from poly(l:C)-injected mothers pretreated with control antibodies (n = 20 (Poly(l:C),Cont)). (F) The disorganized patches of cortex observed in fetuses from poly(l:C)-injected mothers were categorized into groups based on morphology: Protrusions, intrusions or other abnormal patterns and their representative images are shown. (G) Percentage of the cortical patches in each category (n = 24 (Poly(l:C), Cont)). (H) Thickness of the cortical plate in E18.5 fetal brains, derived from PBS- or poly(l:C)-injected mothers, pretreated with isotype control or IL-17a blocking antibodies (n = 20 (PBS, Cont), n = 20 (PBS, anti-IL-17a), n = 20 (Poly(l:C), Cont), n = 20 (Poly(l:C), anti-IL-17a), 5 independent experiments). (A, B and F) Scale bar represents 100 µm. One-way ANOVA (C and H) and Two-way ANOVA (D) with Tukey post-hoc tests. **P < 0.01 and *P < 0.05. Graphs show mean ± SEM.
Fig. 3
Fig. 3. The IL-17a pathway promotes ASD-like phenotypes in the MIA offspring
(A) Ultrasonic vocalization (USV) assay. At P9, pups from the indicated experimental groups were separated from their mothers to elicit USV calls. The number of pup calls is plotted on the y-axis (n = 25 (PBS, Cont), n = 28 (PBS, anti-IL-17a), n = 38 (Poly(l:C), Cont), n = 34 (Poly(l:C), anti-IL-17a); from 6–7 independent experiments. (B) Social approach behavior. Graphed as a social preference index (% time spent investigating social or inanimate stimulus out of total object investigation time) (n = 15 (PBS, Cont), n = 15 (PBS, anti-IL-17a), n = 16 (Poly(l:C), Cont), n = 20 (Poly(l:C), anti-IL-17a); from 6–7 independent experiments. (C) Marble burying behavior. Percentage of the number of buried marbles is plotted on the y-axis (n = 15 (PBS, Cont), n = 15 (PBS, anti-IL-17a), n = 15 (Poly(l:C), Cont), n = 20 (Poly(l:C), anti-IL-17a); from 6–7 independent experiments. (D) Total distance traveled during social approach behavior. (A, C and D) One-way ANOVA with Tukey post-hoc tests. (B) Two-way ANOVA with Tukey post-hoc tests. **P < 0.01 and *P < 0.05. Graphs show mean ± SEM.
Fig. 4
Fig. 4. RORγt expression in maternal T cells is required for manifestation of ASD-like phenotypes in the MIA model
(A) SATB2 and TBR1 staining in the cortex of E18.5 fetal brains following MIA induction with poly(l:C) in mothers with the indicated genotypes. II–IV, V and VI refer to different cortical layers. Images are representative of three independent experiments. Scale bar represents 100 µm. (B) Quantification of TBR1 and SATB2 positive cells in a 300×300 µm2 ROI centered on the malformation in the cortical plate of E18.5 male fetal brains (n = 6 (PBS, WT), n = 6 (Poly(l:C), WT), n = 6 (Poly(l:C), RORγt-TKO)). (C) Number of ultrasonic vocalizations (USV)s emitted by P9 pups. Total USVs emitted during test period (3 min) are plotted on the y-axis (n = 16,18 and 15 offspring from PBS-treated WT, RORγt HET and RORγt TKO mothers; n = 15,11 and 28 from poly(l:C)-treated WT, RORγt HET and RORγt TKO mothers); data from 4–7 independent dams. (D) Social approach behavior is graphed as a social preference index (% time spent investigating social or inanimate stimulus/ total exploration time for both objects), (n = 21, 15 and 15 adult offspring from PBS-treated WT, RORγt HET and RORγt TKO mothers; n = 36,15 and 21 from poly(l:C)-treated WT, RORγt HET and RORγt TKO mothers); data from 4–7 independent dams. (E) Marble burying behavior is graphed as the percentage of buried marbles, (n = 14,19 and 15 adult offspring from PBS-treated WT, RORγt HET and RORγt TKO mothers; n = 32,15 and 25 from poly(l:C)-treated WT, RORγt HET and RORγt TKO mice per group); data from 4–7 independent dams. (F) Total distance moved by offspring tested for social behavior and marble burying. RORγt HET and RORγt TKO refer to RORγNeo/+; CD4-Cre/+ and RORγtFL/RORγNeo; CD4-Cre/+, respectively. (C) One-way ANOVA with Holm-Sidak post-hoc tests. (B and D) Two-way ANOVA with Tukey post-hoc tests. (E and F) One-way ANOVA with Tukey post-hoc tests. ***P <0.001, **P < 0.01 and *P < 0.05. Graphs show mean ± SEM.
Fig. 5
Fig. 5. IL-17a administration to the fetus promotes abnormal cortical development and ASD-like behavioral phenotypes
(A) Schematic diagram of the experimental method. Each embryo was injected intraventricularly at E14.5 with PBS or recombinant IL-17a protein mixed with Fastgreen dye. (B) SATB2 and TBR1 staining in the cortex of E18.5 male fetal brains treated as in (A). Images are representative of five independent experiments. (C) Quantification of TBR1 and SATB2 positive cells in a 300-µm wide ROI corresponding to the region of the cortical plate containing the malformation in E18.5 male fetal brain (n = 20 (PBS), n = 20 (IL-17a)). (D) The spatial location of the disorganized cortical patch in E18.5 fetal brain (n = 20 (IL-17a)). (E) Percentage of the cortical patches in each category (n = 20 (IL-17a)). (F) Ultrasonic vocalization (USV) assay. The number of pup calls is plotted on the y-axis (n = 15 (PBS), n = 17 (IL-17a); from 5–6 independent dams per treatment). (G) Social approach behavior. Graphed as a social preference index (% time spent investigating social or inanimate stimulus out of total object investigation time) (n = 12 (PBS), n = 18 (IL-17a), from 5–6 independent experiments). (H) Marble burying behavior. Percentage of the number of buried marbles is plotted on the y-axis (n = 12 (PBS), n = 18 (IL-17a), from 5–6 independent experiments). (I) Total distance traveled during social approach test. (C) Two-way ANOVA with Tukey post-hoc tests. (F, H and I) Student's t tests. (G) One-way ANOVA with Tukey post-hoc test. **P < 0.01, *P < 0.05, and ns; not significant. Graphs show mean ± SEM.
Fig. 6
Fig. 6. Therapeutic effects of blocking IL-17a signaling in pregnant dams
(A) Schematic diagram of the experimental design. At E12.5, pregnant mothers were injected with PBS or poly(l:C) to induce MIA. Two days later (E14.5), the pregnant mothers were treated with isotype or anti-IL-17a blocking antibodies. At P7~P9, pups were separated from the mothers to measure USV calls. At ~8wks, male offspring were subjected to the social approach test and marble burying test. (B) Ultrasonic vocalization (USV) assay. The number of pup calls is plotted on the y-axis (n = 17 (PBS + Cont), n = 17 (Poly(l:C) + Cont), n = 27 (Poly(l:C) + anti-IL-17a; from 3–4 independent dams per treatment). (C) Social approach behavior. Graphed as a social preference index (% time spent investigating social or inanimate stimulus out of total object investigation time) (n = 12 (PBS + Cont), n = 10 (Poly(l:C) + Cont), n = 17 (Poly(l:C) + anti-IL-17a; from 3–4 independent dams per treatment). (D) Marble burying behavior. Percentage of the number of buried marbles is plotted on the y-axis (n = 12 (PBS + Cont), n = 10 (Poly(l:C) + Cont), n = 17 (Poly(l:C) + anti-IL-17a; from 3–4 independent dams per treatment). (E) Total distance traveled during social approach behavior. (B, D and E) One-way ANOVA with Tukey post-hoc tests. (C) Two-way ANOVA with Tukey post-hoc test. **P < 0.01 and *P < 0.05. Graphs show mean ± SEM.

Comment in

References

    1. Atladóttir HO, Thorsen P, Østergaard L, Schendel DE, Lemcke S, Abdallah M, Parner ET. Maternal infection requiring hospitalization during pregnancy and autism spectrum disorders. J Autism Dev. Disord. 2010;40:1423–1430. - PubMed
    1. Patterson PH. Immune involvement in schizophrenia and autism: Etiology, pathology and animal models. Behav. Brain Res. 2009;204:313–321. - PubMed
    1. Brown AS, Sourander A, Hinkka-Yli-Salomäki S, McKeague IW, Sundvall J, Surcel HM. Elevated maternal C-reactive protein and autism in a national birth cohort. Mol. Psychiatry. 2014;19:259–264. - PMC - PubMed
    1. Atladóttir HO, Pedersen MG, Thorsen P, Mortensen PB, Deleuran B, Eaton WW, Parner ET. Association of family history of autoimmune diseases and autism spectrum disorders. Pediatrics. 2009;124:687–694. - PubMed
    1. Ashwood P, Wills S, Van de Water J. The immune response in autism: A new frontier for autism research. J Leukoc. Biol. 2006;80:1–15. - PubMed

Publication types

MeSH terms