. 2016 Feb 19;351(6275):871-5.
doi: 10.1126/science.aad7974. Epub 2016 Jan 28.

2.3 Å resolution cryo-EM structure of human p97 and mechanism of allosteric inhibition

Affiliations

2.3 Å resolution cryo-EM structure of human p97 and mechanism of allosteric inhibition

Soojay Banerjee et al. Science. .

Abstract

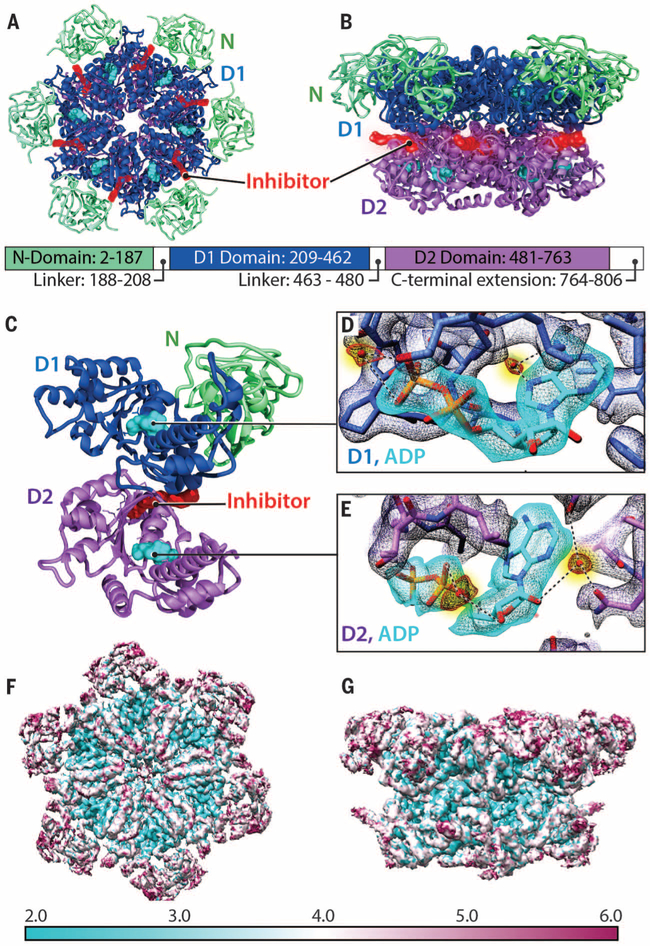
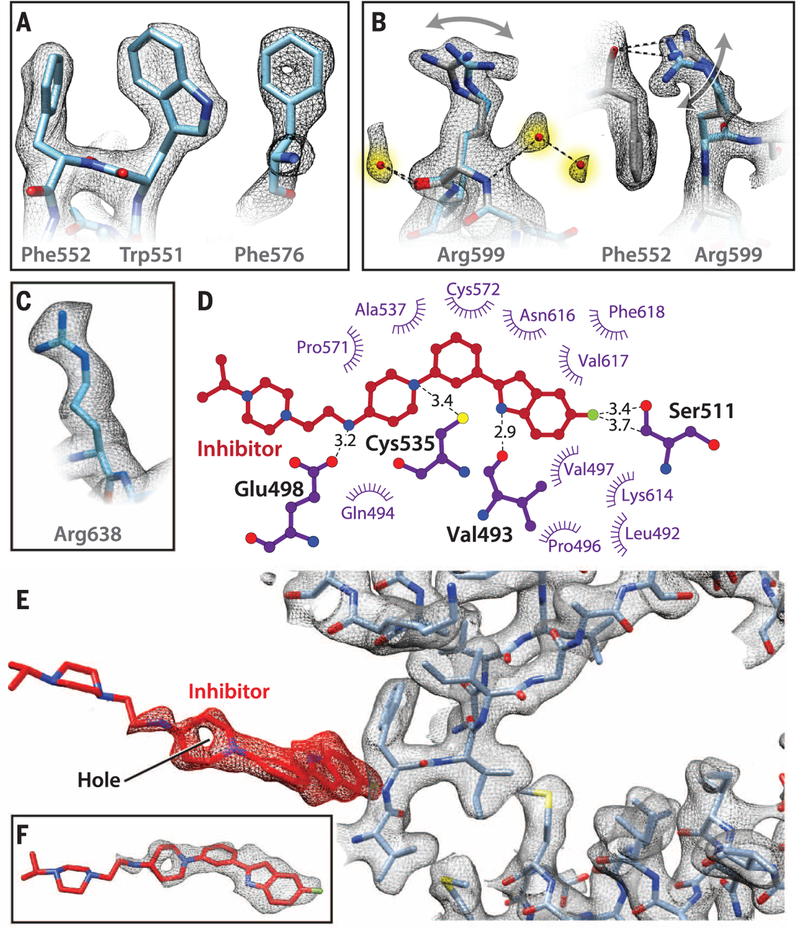
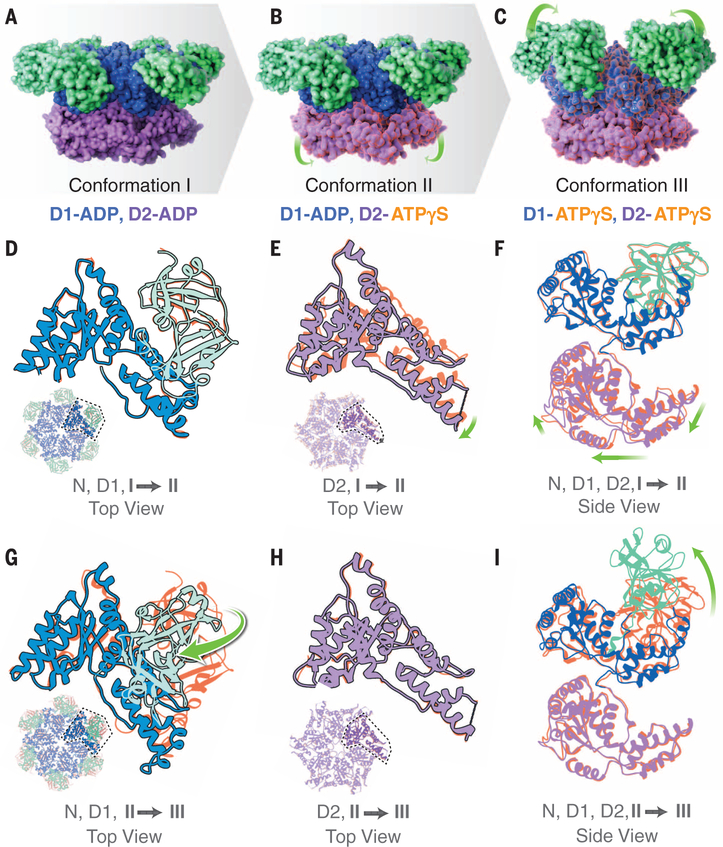
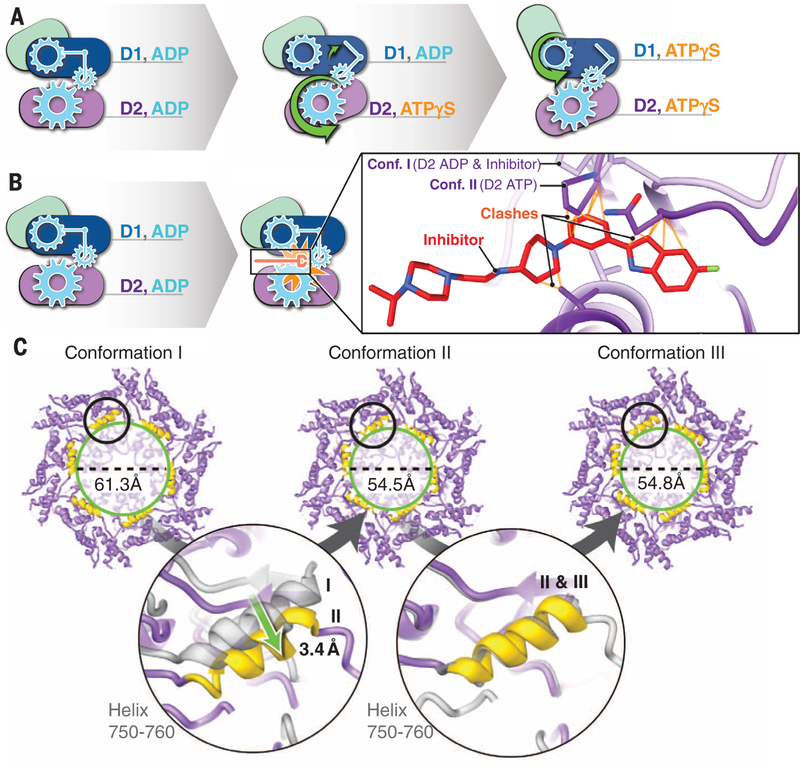
p97 is a hexameric AAA+ adenosine triphosphatase (ATPase) that is an attractive target for cancer drug development. We report cryo-electron microscopy (cryo-EM) structures for adenosine diphosphate (ADP)-bound, full-length, hexameric wild-type p97 in the presence and absence of an allosteric inhibitor at resolutions of 2.3 and 2.4 angstroms, respectively. We also report cryo-EM structures (at resolutions of ~3.3, 3.2, and 3.3 angstroms, respectively) for three distinct, coexisting functional states of p97 with occupancies of zero, one, or two molecules of adenosine 5'-O-(3-thiotriphosphate) (ATPγS) per protomer. A large corkscrew-like change in molecular architecture, coupled with upward displacement of the N-terminal domain, is observed only when ATPγS is bound to both the D1 and D2 domains of the protomer. These cryo-EM structures establish the sequence of nucleotide-driven structural changes in p97 at atomic resolution. They also enable elucidation of the binding mode of an allosteric small-molecule inhibitor to p97 and illustrate how inhibitor binding at the interface between the D1 and D2 domains prevents propagation of the conformational changes necessary for p97 function.


Figures

Fig. 1.
Fig. 1.. Atomic-resolution model derived from cryo-EM structure of p97 in the presence of bound inhibitor.
(A and B) Top and side views, respectively, of the cryo-EM structure of the p97 hexamer presented as a ribbon diagram, showing the N (green), D1 (blue), and D2 (purple) domains. The ADP molecule is colored cyan. The inhibitor (red) is bound at the junction between the D1 and D2 domains. The relative position of each domain in the primary sequence is indicated. (C) Ribbon diagram of a p97 protomer highlighting the location of the bound inhibitor (red) relative to the two bound nucleotides (cyan) in D1 and D2 domains. (D and E) Density maps for bound nucleotides, establishing that ADP is bound to both D1 and D2 domains, and visualization of densities for tightly bound water molecules (colored red, highlighted in yellow) at the nucleotide-binding sites. (F and G) Top and side views, respectively, of the structure (uncorrected density map), color-coded to represent variation in resolution across the protein as determined using ResMap (28).
Fig. 2.
Fig. 2.. Depiction of cryo-EM map quality and inhibitor interactions.
(A) Illustration of hydrophobic packing between the aromatic side chains of Trp551 and Phe552, and the presence of a hole in the aromatic ring of Phe576. (B) Density for water molecules hydrogen-bonded to the Arg599 backbone and evidence for alternate conformations of the terminal guanidinium group, shown in orthogonal orientations. The main-chain oxygen atom of Phe552 shown in (A) is hydrogen-bonded to the Arg599 guanidinium moiety. (C) Density for Arg638, part of the “arginine finger” motif at the outer surface of the D2 domain. (D) LIGPLOT representation showing residues in p97 that are in close proximity to the inhibitor, highlighting key H-bond interactions between the nitrogen on the indole ring and the backbone carbonyl oxygen atom of Val493 and side chain of Glu498 with the nitrogen atom in the linker of the inhibitor. The interaction between the fluorine atom present on the indole ring of the inhibitor and the main-chain carbonyl atom of Ser511 is also indicated. (E and F) Close-up view of the conformation of UPCDC30245 bound to p97 shown along with selected residues in its vicinity. There is strong density for the bound inhibitor for the segment encompassing the indole group to the piperidine ring and virtually no density at the other extremity, where the molecule is expected to be highly flexible because of minimal interactions with the protein.
Fig. 3.
Fig. 3.. Cryo-EM structures at ~3.3 Å, ~3.2 Å, and ~3.3 Å resolution, respectively, of three distinct p97 conformational states populated upon addition of ATPγS.
(A to C) Side views of molecular surface models of the three states, color-coded to show the N, D1, and D2 domains in green, blue, and purple, respectively. The green arrows indicate the motion of the D2 domain in the transition from conformation I to II (B) and the motion of the N domain in the transition from conformation II to III (C). (D to F) Superposition of the polypeptide backbones of conformations I and II in ribbon representation to illustrate that the N and D1 domains display similar conformations but that there are substantial differences in the D2 domain, as indicated by the green arrows. The color scheme for conformation II is as in (A) to (C), with conformation I shown in orange. (G to I) Superposition of the polypeptide backbones of conformations II and III in ribbon representation to illustrate that the D2 domain is similar but that there are substantial differences in conformation of the N and D1 domains, as indicated by the green arrows. The color scheme for conformation III is as in (A) to (C), with conformation II now shown in orange. The insets in (D) and (G) show top views of the D1 domain; the insets in (E) and (H) show top views of the D2 domain, providing context for the superpositions shown in the main panels.
Fig. 4.
Fig. 4.. Mechanism of ATP-driven conformational change.
(A) Schematic of the two-step sequence involved in p97 activation resulting from the sequential binding of ATPγS first to D2 and then to D1, resulting in a large-scale movement of the N domain. (B) Close-up view of the location of the bound inhibitor when ADP is present in both D1 and D2 domains, indicating that there is a steric clash with the structure adopted by the D2 polypeptide upon ATPγS binding and that binding of the inhibitor blocks the conformational changes. The steric clashes between conformation II and the bound inhibitor are marked. (C) View of the D2 domain in the three conformational states, illustrating narrowing of the pore diameter (green circles) upon transition from conformation I to II, with minimal further changes upon transition to conformation III. The regions marked by the black circles are highlighted in magnified form in the lower part of the figure. They show views of the protein in the vicinity of residues 750 to 760 in one protomer and illustrate the extent of the helix movement in narrowing of the pore.

Similar articles

Cited by

References

    1. Hanson PI, Whiteheart SW, Nat. Rev. Mol. Cell Biol 6, 519–529 (2005). - PubMed
    1. Ogura T, Wilkinson AJ, Genes Cells 6, 575–597 (2001). - PubMed
    1. Barthelme D, Sauer RT, J. Mol. Biol 10.1016/j.jmb.2015.11.015 (2015). - DOI - PMC - PubMed
    1. Otter-Nilsson M, Hendriks R, Pecheur-Huet EI, Hoekstra D,Nilsson T, EMBO J 18, 2074–2083 (1999). - PMC - PubMed
    1. Meyer H, Weihl CC, J. Cell Sci 127, 3877–3883 (2014). - PMC - PubMed

Publication types

MeSH terms