

Evaluation of O2PLS in Omics data integration
- PMID: 26822911
- PMCID: PMC4959391
- DOI: 10.1186/s12859-015-0854-z
Evaluation of O2PLS in Omics data integration
Abstract
Background: Rapid computational and technological developments made large amounts of omics data available in different biological levels. It is becoming clear that simultaneous data analysis methods are needed for better interpretation and understanding of the underlying systems biology. Different methods have been proposed for this task, among them Partial Least Squares (PLS) related methods. To also deal with orthogonal variation, systematic variation in the data unrelated to one another, we consider the Two-way Orthogonal PLS (O2PLS): an integrative data analysis method which is capable of modeling systematic variation, while providing more parsimonious models aiding interpretation.
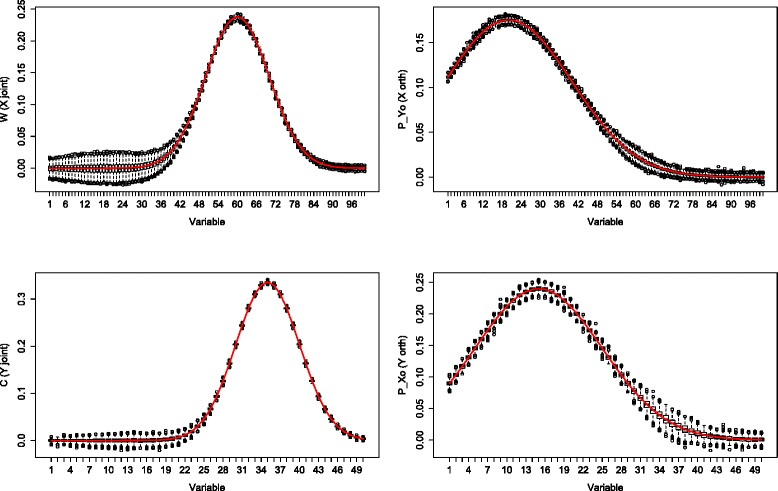
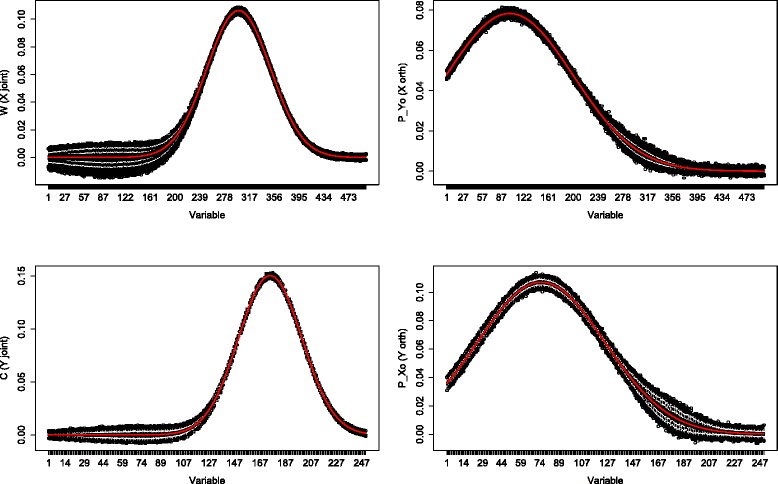
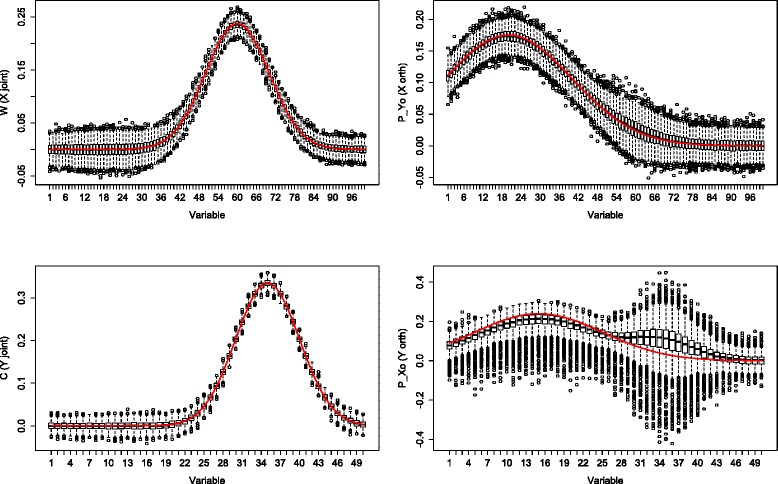
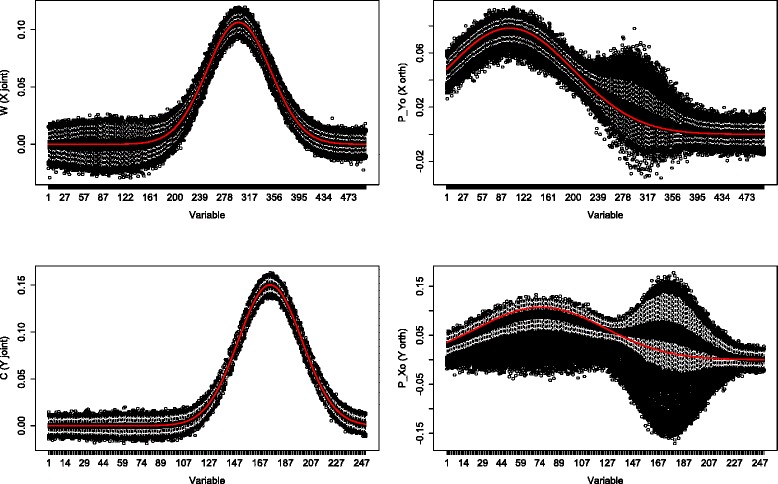
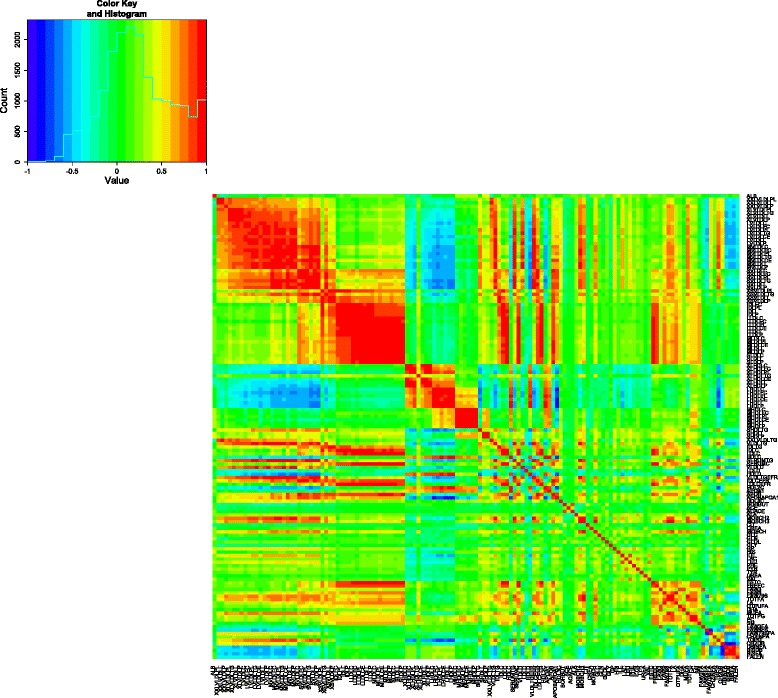
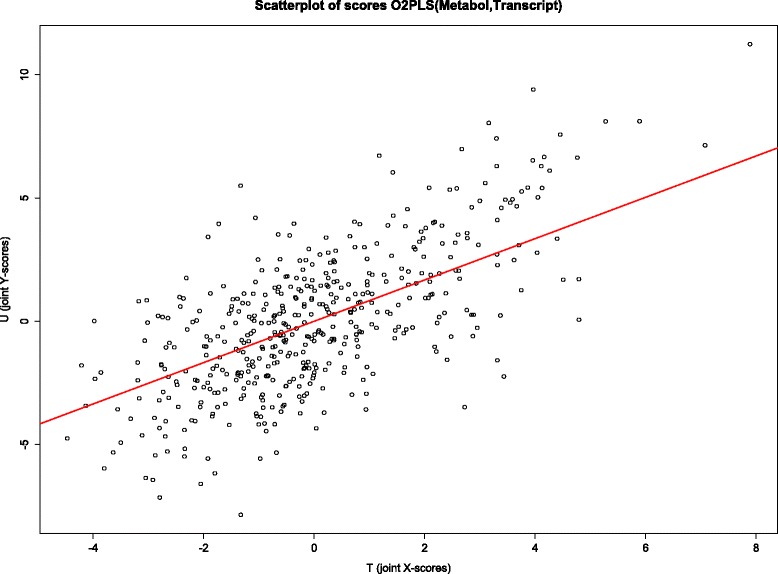
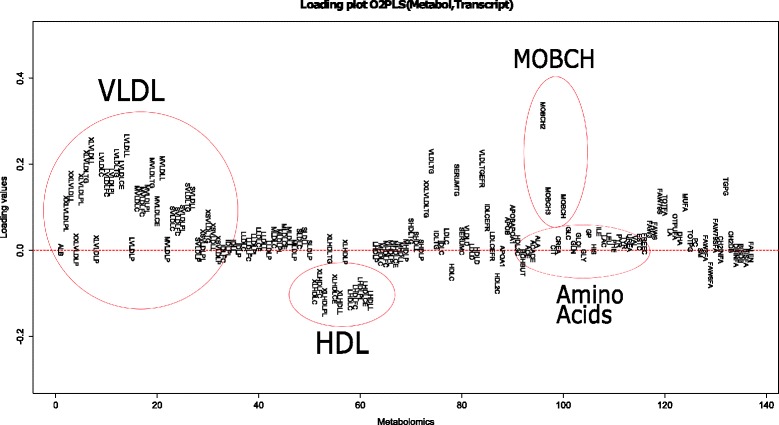
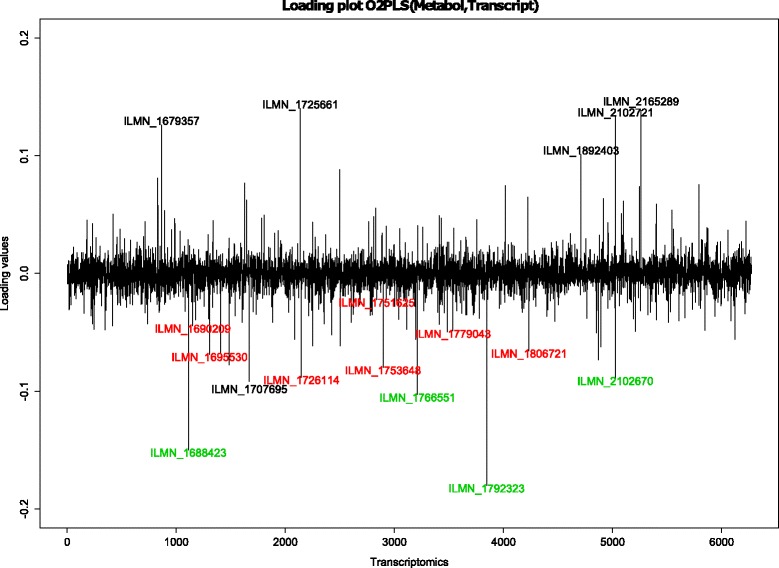
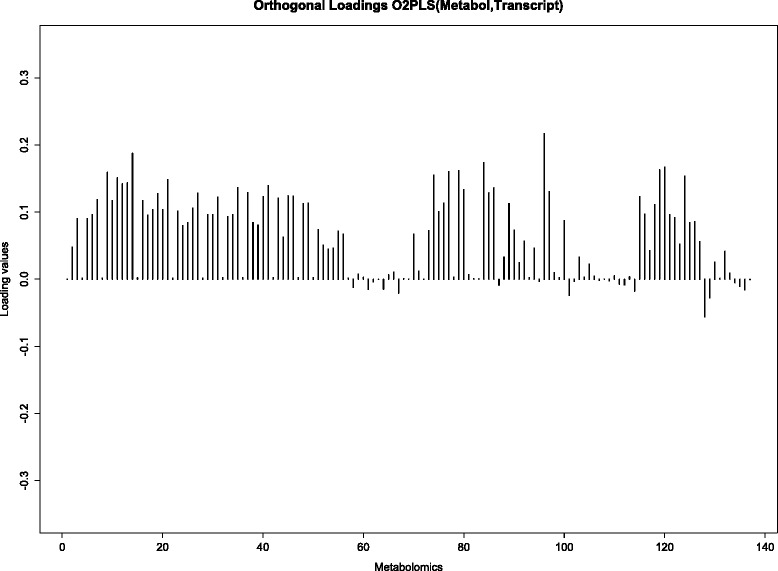
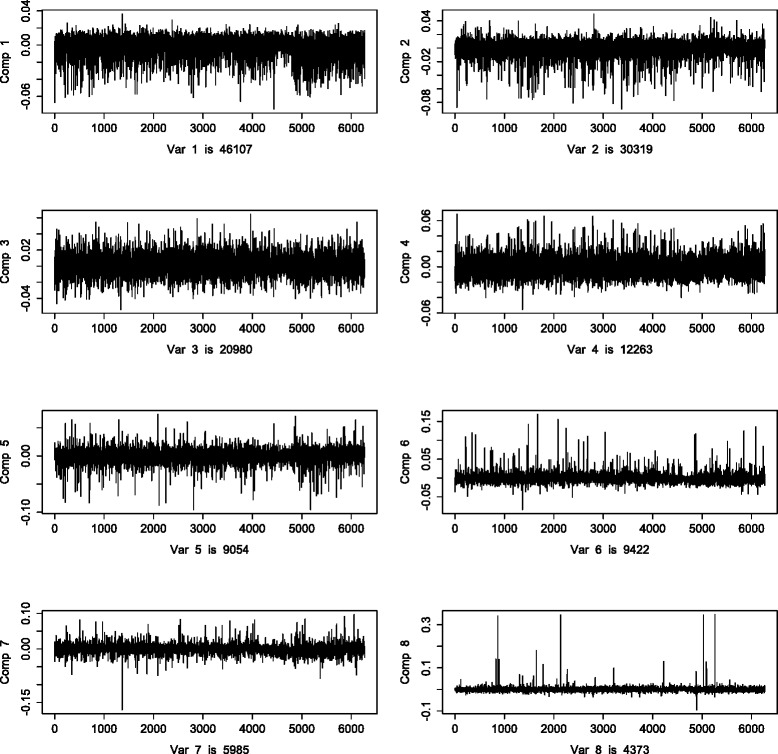
Results: A simulation study to assess the performance of O2PLS showed positive results in both low and higher dimensions. More noise (50 % of the data) only affected the systematic part estimates. A data analysis was conducted using data on metabolomics and transcriptomics from a large Finnish cohort (DILGOM). A previous sequential study, using the same data, showed significant correlations between the Lipo-Leukocyte (LL) module and lipoprotein metabolites. The O2PLS results were in agreement with these findings, identifying almost the same set of co-varying variables. Moreover, our integrative approach identified other associative genes and metabolites, while taking into account systematic variation in the data. Including orthogonal components enhanced overall fit, but the orthogonal variation was difficult to interpret.
Conclusions: Simulations showed that the O2PLS estimates were close to the true parameters in both low and higher dimensions. In the presence of more noise (50 %), the orthogonal part estimates could not distinguish well between joint and unique variation. The joint estimates were not systematically affected. Simultaneous analysis with O2PLS on metabolome and transcriptome data showed that the LL module, together with VLDL and HDL metabolites, were important for the metabolomic and transcriptomic relation. This is in agreement with an earlier study. In addition more gene expression and metabolites are identified being important for the joint covariation.
Figures
References
-
- González I, Déjean S, Martin PGP, Gonçalves O, Besse P, Baccini A. Highlighting relationships between heterogeneous biological data through graphical displays based on regularized canonical correlation analysis. J Biol Syst. 2009;17(02):173–99. doi: 10.1142/S0218339009002831. - DOI
-
- Wold H. Multivariate Analysis (Proc. Internat. Sympos., Dayton, Ohio, 1965) New York: Academic Press; 1966. Estimation of principal components and related models by iterative least squares.
-
- Lê Cao K, Le Gall C. Integration and variable selection of ‘omics’ data sets with pls: a survey. J de la Société Française de Stat. 2011;152(2):77–96.
-
- Tibshirani R. Regression shrinkage and selection via the lasso. J Roy Statist Soc Ser B. 1996;58(1):267–88.
-
- Inouye M, Kettunen J, Soininen P, Silander K, Ripatti S, Kumpula LS, et al.Metabonomic, transcriptomic, and genomic variation of a population cohort. Mol Syst Biol. 2010; 6(1). doi:10.1038/msb.2010.93. - DOI - PMC - PubMed
Publication types
MeSH terms
LinkOut - more resources
Full Text Sources
Other Literature Sources
Medical
