

The potential role of regulator of G-protein signaling 16 in cell motility mediated by δEF1 family proteins
- PMID: 26823172
- PMCID: PMC4819697
- DOI: 10.1002/1873-3468.12042
The potential role of regulator of G-protein signaling 16 in cell motility mediated by δEF1 family proteins
Abstract
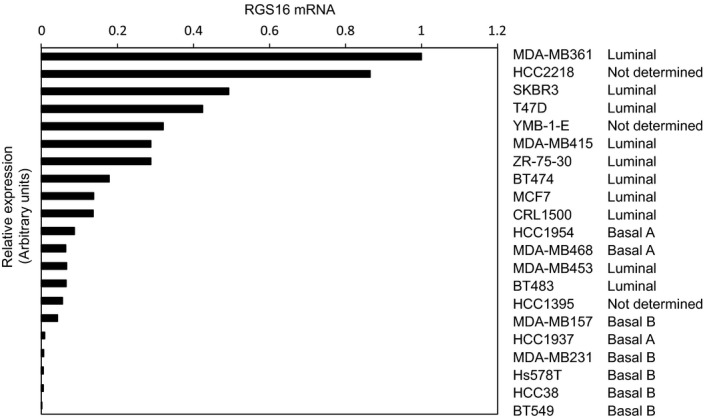
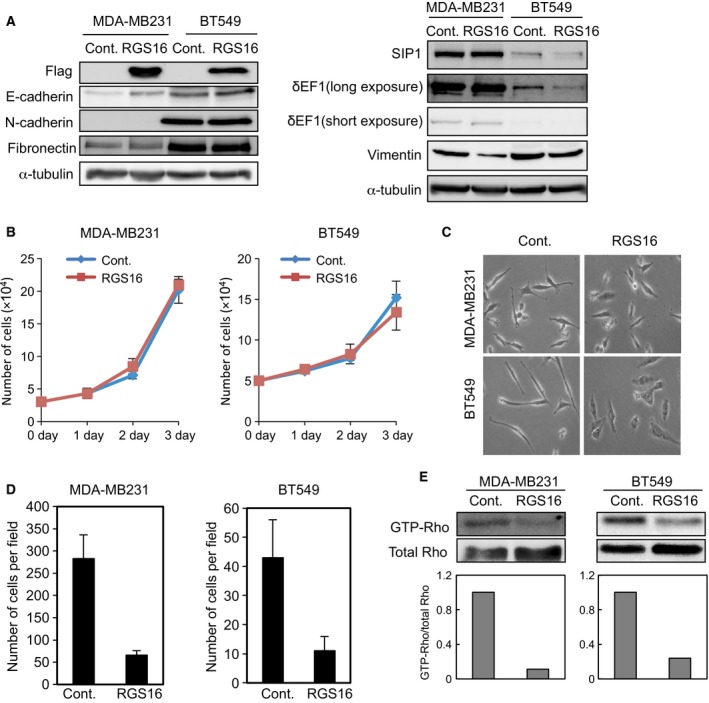
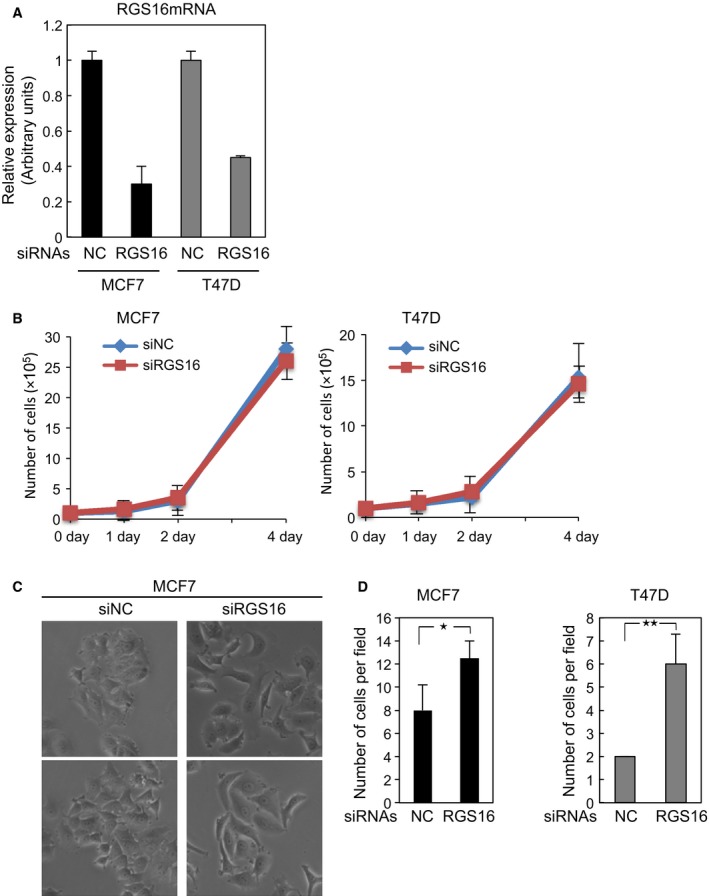
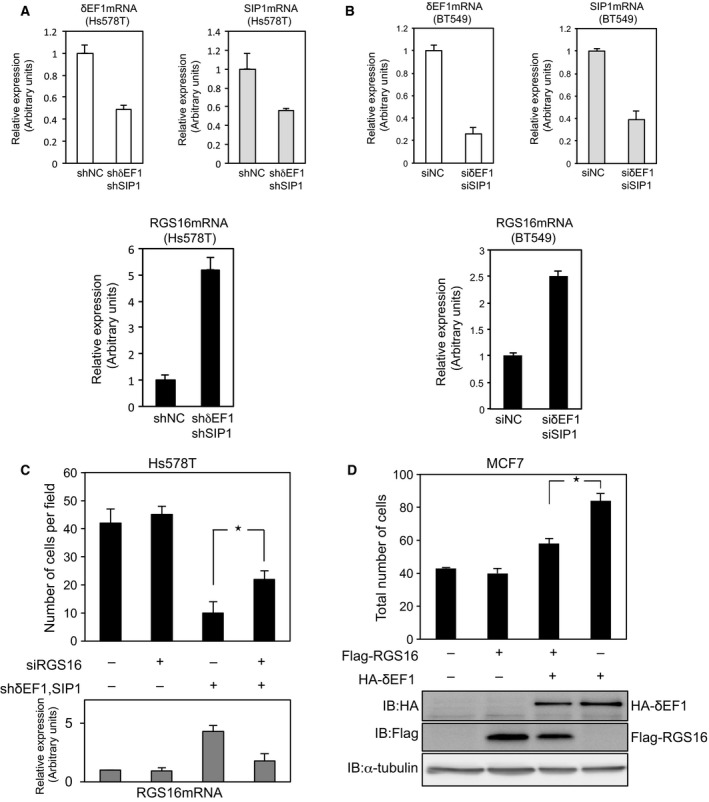
The epithelial-mesenchymal transition (EMT) is associated with tumor progression. We reported previously that expression of the δEF1 family proteins (δEF1/ZEB1 and SIP1/ZEB2), key regulators of the EMT, is positively correlated with EMT phenotypes and aggressiveness of breast cancer. Here, we show that the expression levels of regulator of G-protein signaling 16 (RGS16) are negatively correlated with those of the δEF1 family proteins. On the basis of the results of gain- and loss-of-function analyses, we suggest that δEF1 family proteins promote cell motility of breast cancer cells directly or indirectly through repressing expression of RGS16.
Keywords: epithelial-mesenchymal transition; regulator of G-protein signaling 16; smad-interacting protein 1; δEF1; δEF1 family proteins.
© 2015 The Authors. FEBS Letters published by John Wiley & Sons Ltd on behalf of Federation of European Biochemical Societies.
Figures
Similar articles
-
Differential regulation of epithelial and mesenchymal markers by deltaEF1 proteins in epithelial mesenchymal transition induced by TGF-beta.Mol Biol Cell. 2007 Sep;18(9):3533-44. doi: 10.1091/mbc.e07-03-0249. Epub 2007 Jul 5. Mol Biol Cell. 2007. PMID: 17615296 Free PMC article.
-
DeltaEF1 is a transcriptional repressor of E-cadherin and regulates epithelial plasticity in breast cancer cells.Oncogene. 2005 Mar 31;24(14):2375-85. doi: 10.1038/sj.onc.1208429. Oncogene. 2005. PMID: 15674322
-
SIP1 (Smad interacting protein 1) and deltaEF1 (delta-crystallin enhancer binding factor) are structurally similar transcriptional repressors.J Bone Joint Surg Am. 2001;83-A Suppl 1(Pt 1):S40-7. J Bone Joint Surg Am. 2001. PMID: 11263664 Review.
-
Ets1 and ESE1 reciprocally regulate expression of ZEB1/ZEB2, dependent on ERK1/2 activity, in breast cancer cells.Cancer Sci. 2017 May;108(5):952-960. doi: 10.1111/cas.13214. Epub 2017 May 22. Cancer Sci. 2017. PMID: 28247944 Free PMC article.
-
Oncogenic functions of the EMT-related transcription factor ZEB1 in breast cancer.J Transl Med. 2020 Feb 3;18(1):51. doi: 10.1186/s12967-020-02240-z. J Transl Med. 2020. PMID: 32014049 Free PMC article. Review.
Cited by
-
Ikzf2 Regulates the Development of ICOS+ Th Cells to Mediate Immune Response in the Spleen of S. japonicum-Infected C57BL/6 Mice.Front Immunol. 2021 Aug 12;12:687919. doi: 10.3389/fimmu.2021.687919. eCollection 2021. Front Immunol. 2021. PMID: 34475870 Free PMC article.
-
Regulator of G-Protein Signaling 16 Is a Negative Modulator of Platelet Function and Thrombosis.J Am Heart Assoc. 2019 Mar 5;8(5):e011273. doi: 10.1161/JAHA.118.011273. J Am Heart Assoc. 2019. PMID: 30791801 Free PMC article.
-
Regulator of G protein signaling 16 restrains apoptosis in colorectal cancer through disrupting TRAF6-TAB2-TAK1-JNK/p38 MAPK signaling.Cell Death Dis. 2024 Jun 21;15(6):438. doi: 10.1038/s41419-024-06803-6. Cell Death Dis. 2024. PMID: 38906869 Free PMC article.
-
Functions of regulators of G protein signaling 16 in immunity, inflammation, and other diseases.Front Mol Biosci. 2022 Sep 2;9:962321. doi: 10.3389/fmolb.2022.962321. eCollection 2022. Front Mol Biosci. 2022. PMID: 36120550 Free PMC article. Review.
-
RGS16 promotes glioma progression and serves as a prognostic factor.CNS Neurosci Ther. 2020 Aug;26(8):791-803. doi: 10.1111/cns.13382. Epub 2020 Apr 22. CNS Neurosci Ther. 2020. PMID: 32319728 Free PMC article.
References
-
- Wiechec E, Overgaard J and Hansen LL (2008) A fragile site within the HPC1 region at 1q25.3 affecting RGS16, RGSL1, and RGSL2 in human breast carcinomas. Genes Chromosom Cancer 47, 766–780. - PubMed
-
- Kim JH, Lee JY, Lee KT, Lee JK, Lee KH, Jang KT, Heo JS, Choi SH and Rhee JC (2010) RGS16 and FosB underexpressed in pancreatic cancer with lymph node metastasis promote tumor progression. Tumour Biol 31, 541–548. - PubMed
-
- Thiery JP, Acloque H, Huang RY and Nieto MA (2009) Epithelial‐mesenchymal transitions in development and disease. Cell 139, 871–890. - PubMed
Publication types
MeSH terms
Substances
LinkOut - more resources
Full Text Sources
Other Literature Sources
Molecular Biology Databases
Research Materials
