

Bacteriophages affect evolution of bacterial communities in spatially distributed habitats: a simulation study
- PMID: 26823184
- PMCID: PMC4895265
- DOI: 10.1186/s12866-015-0620-4
Bacteriophages affect evolution of bacterial communities in spatially distributed habitats: a simulation study
Erratum in
-
Erratum to: Bacteriophages affect evolution of bacterial communities in spatially distributed habitats: a simulation study.BMC Microbiol. 2016 Apr 14;16:67. doi: 10.1186/s12866-016-0677-8. BMC Microbiol. 2016. PMID: 27079662 Free PMC article. No abstract available.
Abstract
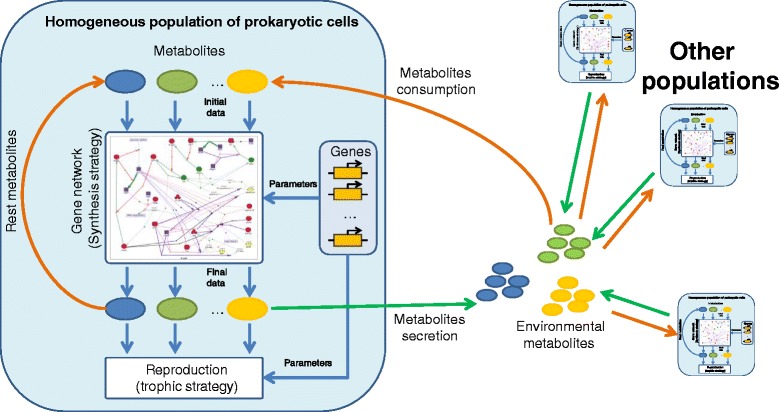
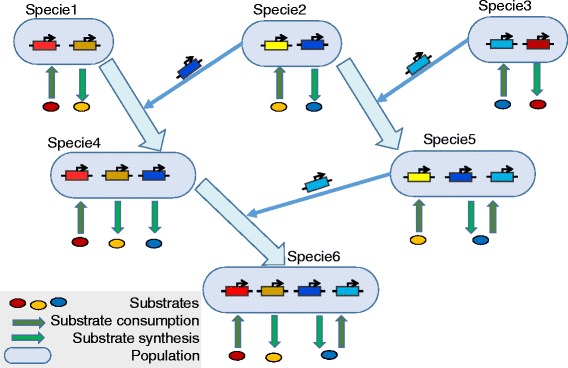
Background: Bacteriophages are known to be one of the driving forces of bacterial evolution. Besides promoting horizontal transfer of genes between cells, they may induce directional selection of cells (for instance, according to more or less resistance to phage infection). Switching between lysogenic and lytic pathways results in various types of (co)evolution in host-phage systems. Spatial (more generally, ecological) organization of the living environment is another factor affecting evolution. In this study, we have simulated and analyzed a series of computer models of microbial communities evolving in spatially distributed environments under the pressure of phage infection.
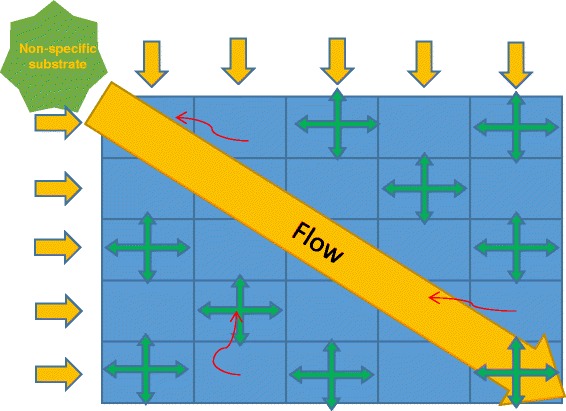
Results: We modeled evolving microbial communities living in spatially distributed flowing environments. Non-specific nutrient supplied in the only spatial direction, resulting in its non-uniform distribution in environment. We varied the time and the location of initial phage infestation of cells as well as switched chemotaxis on and off. Simulations were performed with the Haploid evolutionary constructor software ( http://evol-constructor.bionet.nsc.ru/ ).
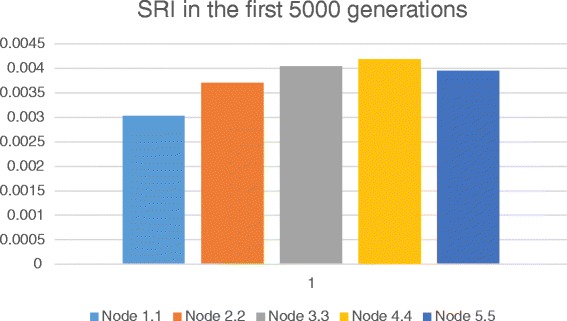
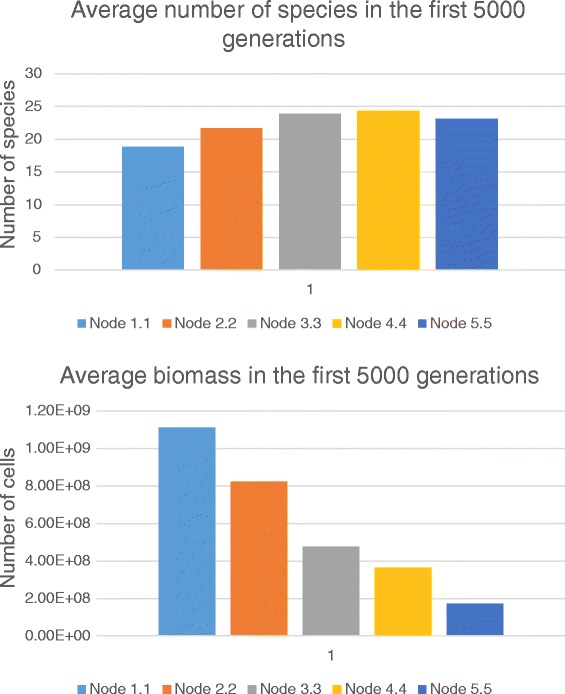
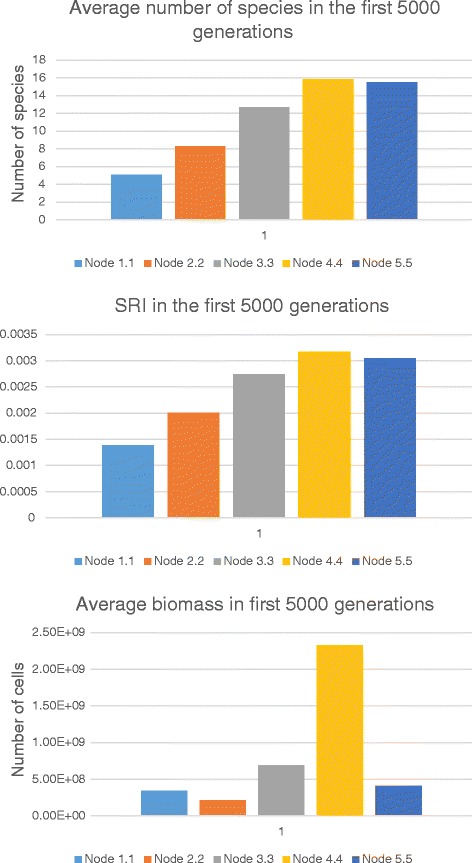
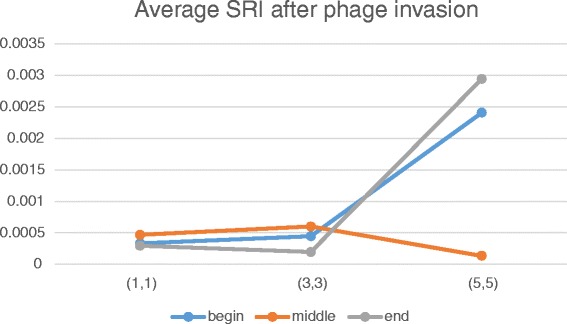
Conclusion: Simulations have shown that the spatial location of initial phage invasion may lead to different evolutionary scenarios. Phage infection decreases the speciation rate by more than one order as far as intensified selection blocks the origin of novel viable populations/species, which could carve out potential ecological niches. The dependence of speciation rate on the invasion node location varied on the time of invasion. Speciation rate was found to be lower when the phage invaded fully formed community of sedentary cells (at middle and late times) at the species-rich regions. This is especially noticeable in the case of late-time invasion. Our simulation study has shown that phage infection affects evolution of microbial community slowing down speciation and stabilizing the system as a whole. This influencing varied in its efficiency depending on spatially-ecological factors as well as community state at the moment of phage invasion.
Figures

References
-
- Hendrix RW. Bacteriophage Evolution and the Role of Phages in Host Evolution. In: Waldor MK, et al. Phages: their role in bacterial pathogenesis and biotechnology. American Society of Microbiology; 2005:55–65.
Publication types
MeSH terms
LinkOut - more resources
Full Text Sources
Other Literature Sources
