Uricase alkaline enzymosomes with enhanced stabilities and anti-hyperuricemia effects induced by favorable microenvironmental changes
- PMID: 26823332
- PMCID: PMC4731772
- DOI: 10.1038/srep20136
Uricase alkaline enzymosomes with enhanced stabilities and anti-hyperuricemia effects induced by favorable microenvironmental changes
Erratum in
-
Erratum: Uricase alkaline enzymosomes with enhanced stabilities and anti-hyperuricemia effects induced by favorable microenvironmental changes.Sci Rep. 2017 Jun 30;7:46390. doi: 10.1038/srep46390. Sci Rep. 2017. PMID: 28664903 Free PMC article.
Abstract
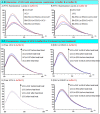
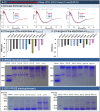
Enzyme therapy is an effective strategy to treat diseases. Three strategies were pursued to provide the favorable microenvironments for uricase (UCU) to eventually improve its features: using the right type of buffer to constitute the liquid media where catalyze reactions take place; entrapping UCU inside the selectively permeable lipid vesicle membranes; and entrapping catalase together with UCU inside the membranes. The nanosized alkaline enzymosomes containing UCU/(UCU and catalase) (ESU/ESUC) in bicine buffer had better thermal, hypothermal, acid-base and proteolytic stabilities, in vitro and in vivo kinetic characteristics, and uric acid lowering effects. The favorable microenvironments were conducive to the establishment of the enzymosomes with superior properties. It was the first time that two therapeutic enzymes were simultaneously entrapped into one enzymosome having the right type of buffer to achieve added treatment efficacy. The development of ESU/ESUC in bicine buffer provides valuable tactics in hypouricemic therapy and enzymosomal application.
Figures


Similar articles
-
Nanocapsule assemblies as effective enzyme delivery systems against hyperuricemia.Nanomedicine. 2016 Aug;12(6):1557-66. doi: 10.1016/j.nano.2016.02.010. Epub 2016 Mar 21. Nanomedicine. 2016. PMID: 27013130
-
Improved biological properties and hypouricemic effects of uricase from Candida utilis loaded in novel alkaline enzymosomes.Int J Nanomedicine. 2012;7:3929-38. doi: 10.2147/IJN.S33835. Epub 2012 Jul 23. Int J Nanomedicine. 2012. PMID: 22915844 Free PMC article.
-
Nanosomal Microassemblies for Highly Efficient and Safe Delivery of Therapeutic Enzymes.ACS Appl Mater Interfaces. 2015 Sep 16;7(36):20255-63. doi: 10.1021/acsami.5b05758. Epub 2015 Sep 1. ACS Appl Mater Interfaces. 2015. PMID: 26325262
-
PEG-uricase in the management of treatment-resistant gout and hyperuricemia.Adv Drug Deliv Rev. 2008 Jan 3;60(1):59-68. doi: 10.1016/j.addr.2007.06.011. Epub 2007 Aug 14. Adv Drug Deliv Rev. 2008. PMID: 17826865 Review.
-
Lipid-polymer hybrid nanoparticles as a new generation therapeutic delivery platform: a review.Eur J Pharm Biopharm. 2013 Nov;85(3 Pt A):427-43. doi: 10.1016/j.ejpb.2013.07.002. Epub 2013 Jul 17. Eur J Pharm Biopharm. 2013. PMID: 23872180 Review.
Cited by
-
Advances in the use of nanotechnology for treating gout.Nanomedicine (Lond). 2025 Feb;20(4):355-369. doi: 10.1080/17435889.2025.2457315. Epub 2025 Jan 28. Nanomedicine (Lond). 2025. PMID: 39873132 Review.
-
Improved delivery of natural alkaloids into lung cancer through woody oil-based emulsive nanosystems.Drug Deliv. 2018 Nov;25(1):1426-1437. doi: 10.1080/10717544.2018.1474970. Drug Deliv. 2018. PMID: 29890855 Free PMC article.
-
CRISPR-Cas9-mediated reactivation of the uricase pseudogene in human cells prevents acute hyperuricemia.Mol Ther Nucleic Acids. 2021 Aug 19;25:578-584. doi: 10.1016/j.omtn.2021.08.002. eCollection 2021 Sep 3. Mol Ther Nucleic Acids. 2021. PMID: 34589279 Free PMC article.
-
Antiviral Drug Delivery System for Enhanced Bioactivity, Better Metabolism and Pharmacokinetic Characteristics.Int J Nanomedicine. 2021 Jul 22;16:4959-4984. doi: 10.2147/IJN.S315705. eCollection 2021. Int J Nanomedicine. 2021. PMID: 34326637 Free PMC article. Review.
-
Recent strategies towards the surface modification of liposomes: an innovative approach for different clinical applications.3 Biotech. 2020 Apr;10(4):163. doi: 10.1007/s13205-020-2144-3. Epub 2020 Mar 10. 3 Biotech. 2020. PMID: 32206497 Free PMC article. Review.
References
-
- Shetty V. & Mohan A. A. Prospective, randomized, double-blind, placebo-controlled clinical trial comparing the efficacy of systemic enzyme therapy for ddema control in orthognathic surgery using ultrasound scan to measure facial swelling. J Oral Maxillofac Surg. 71, 1261–1267 (2013). - PubMed
-
- Spiridigliozzi G. A. et al. Cognitive outcome of patients with classic infantile pompe disease receiving enzyme therapy. Neurology. 80, 1173 (2013). - PubMed
Publication types
MeSH terms
Substances
LinkOut - more resources
Full Text Sources
Other Literature Sources

