

Temperature and blood flow distribution in the human leg during passive heat stress
- PMID: 26823344
- PMCID: PMC4894946
- DOI: 10.1152/japplphysiol.00965.2015
Temperature and blood flow distribution in the human leg during passive heat stress
Abstract
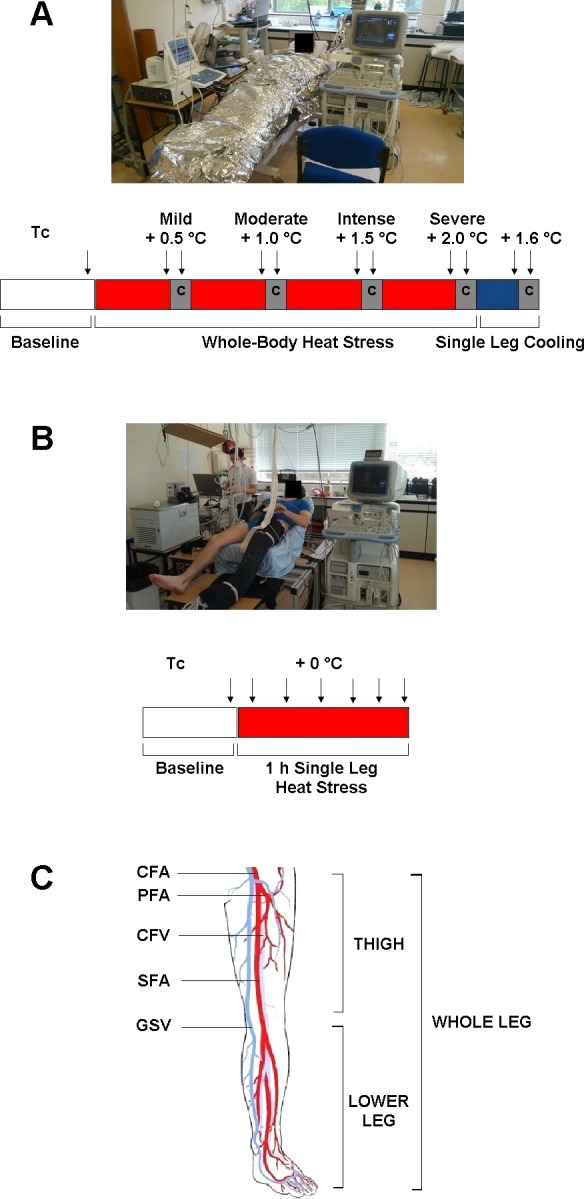
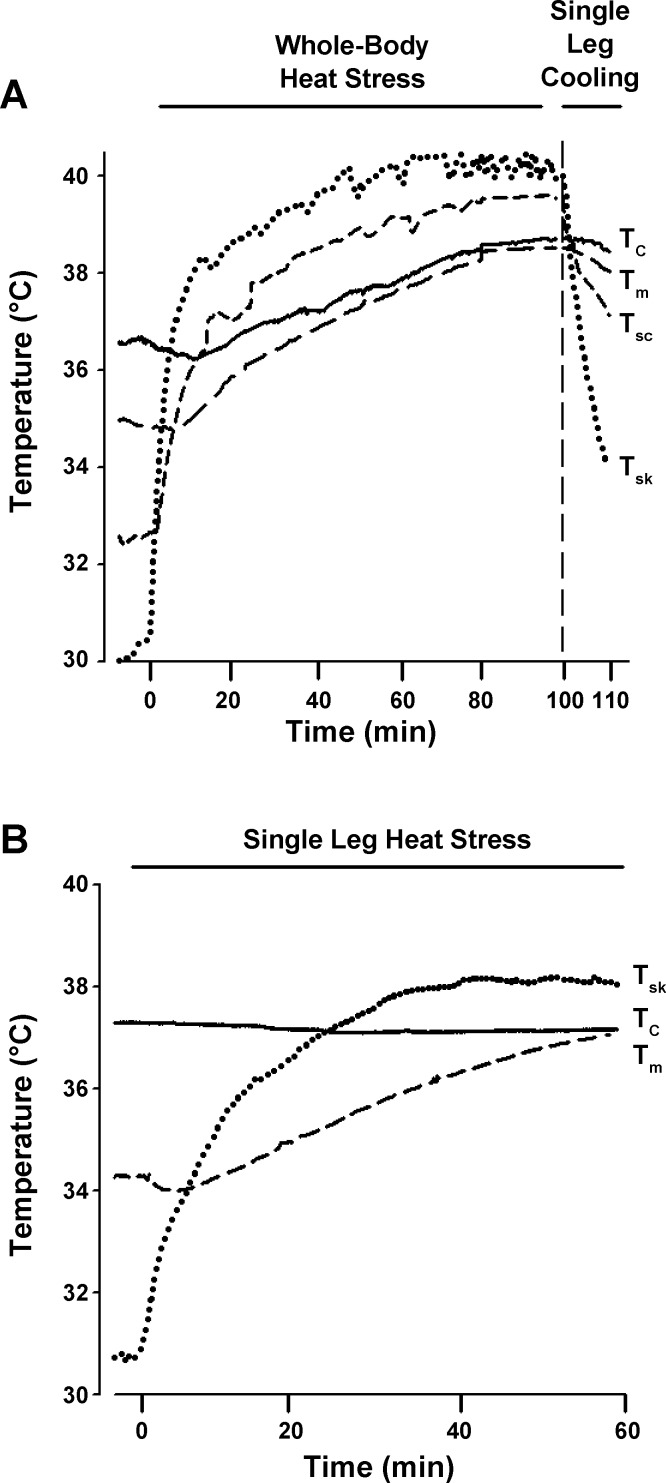
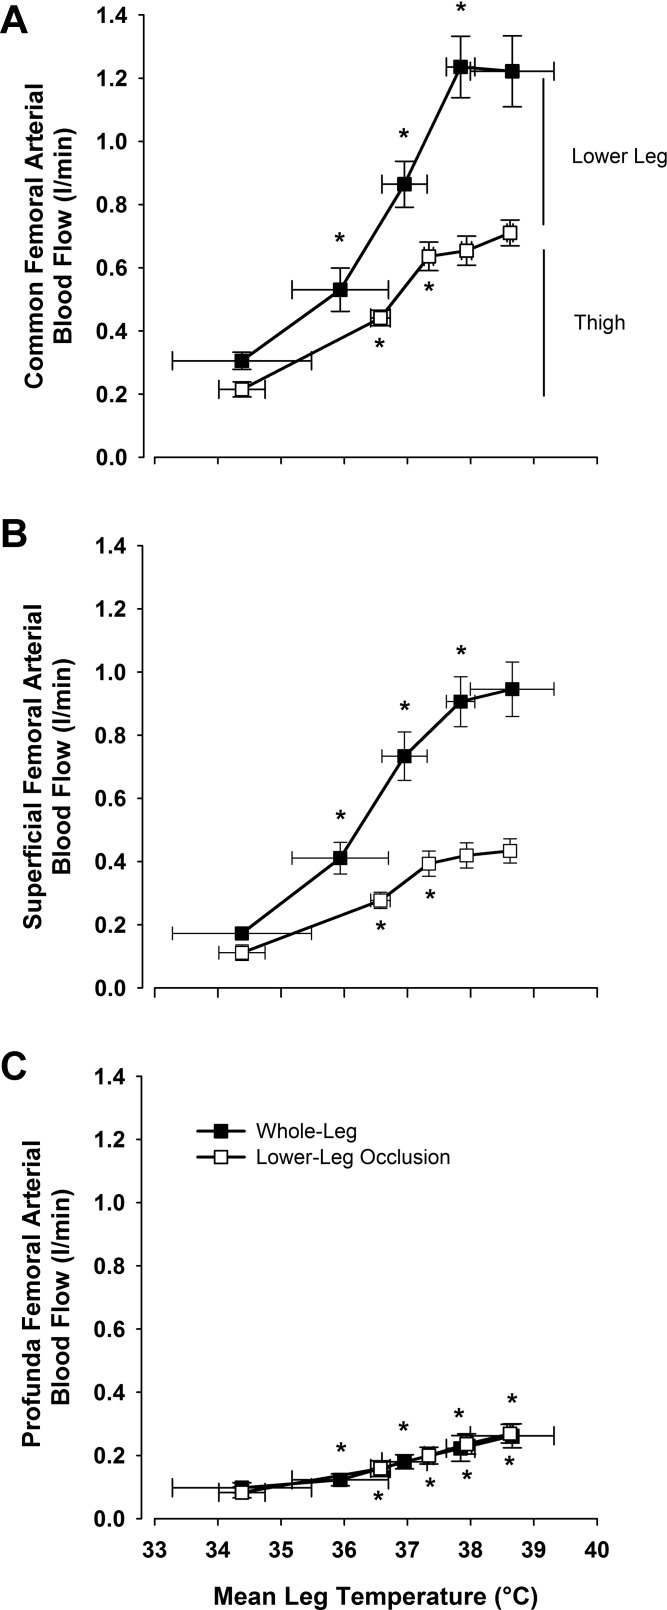
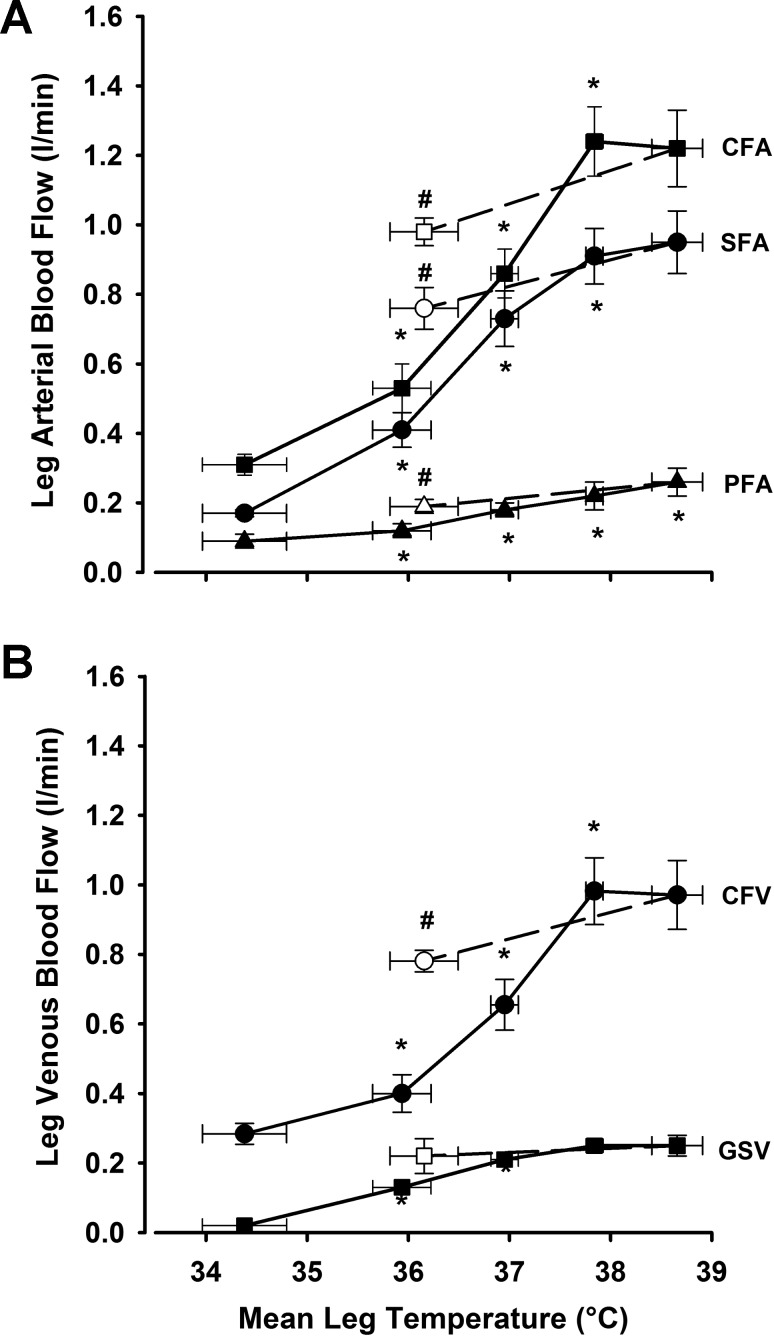
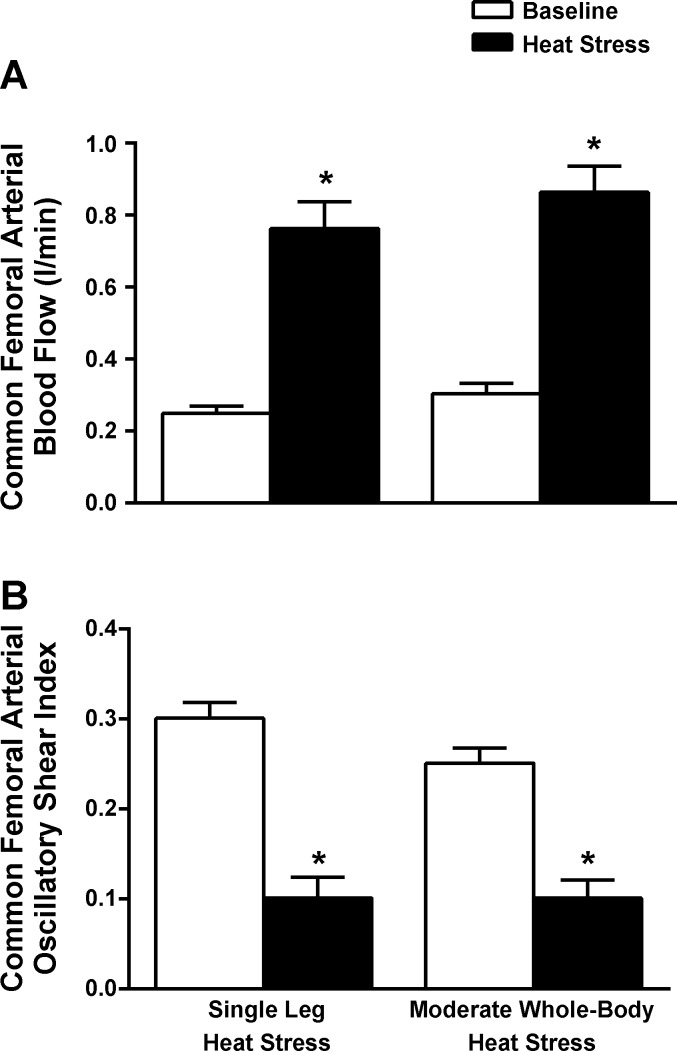
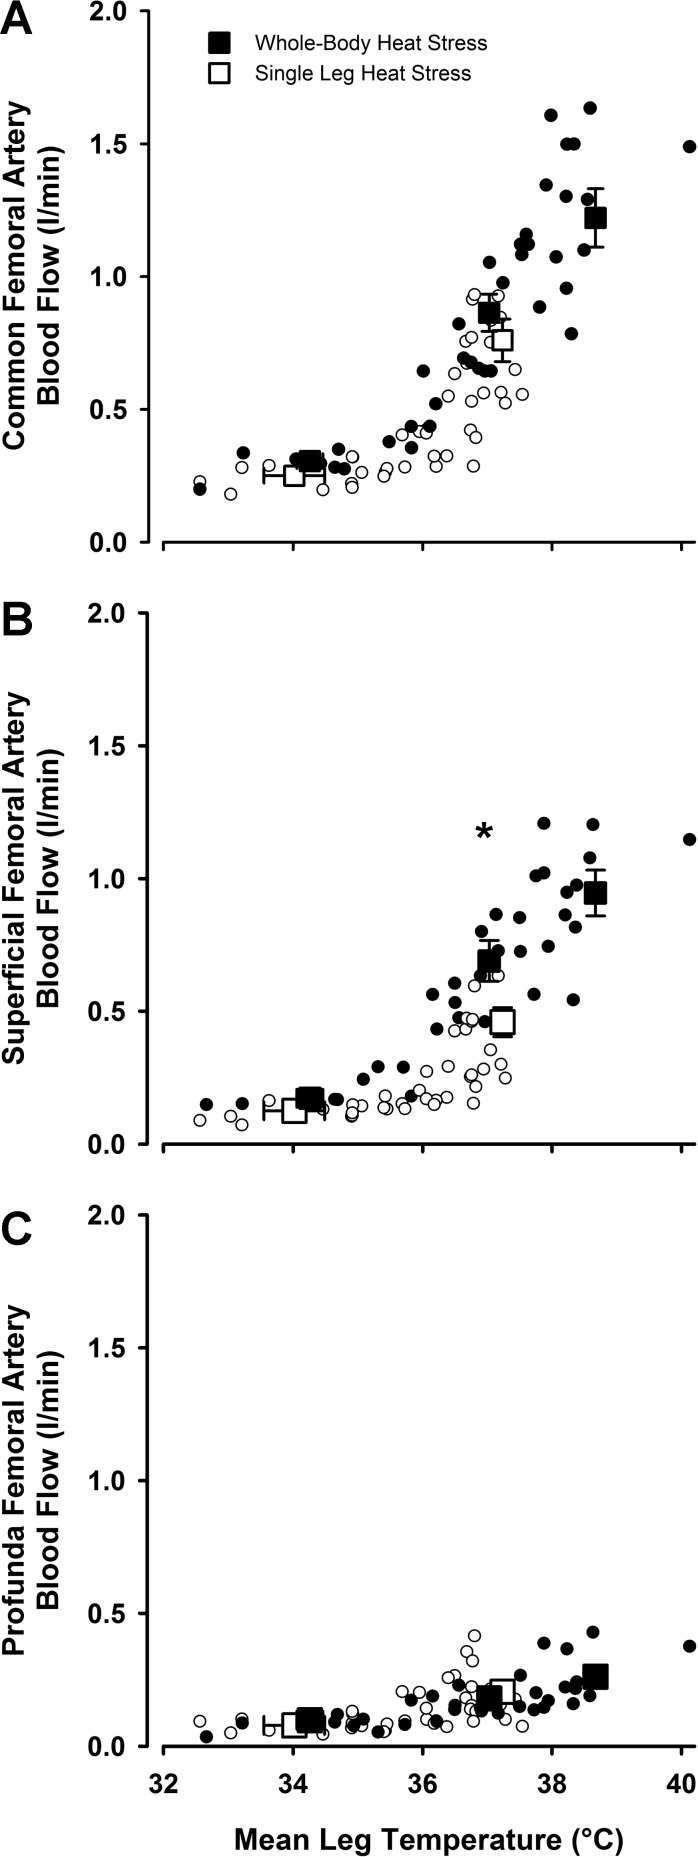
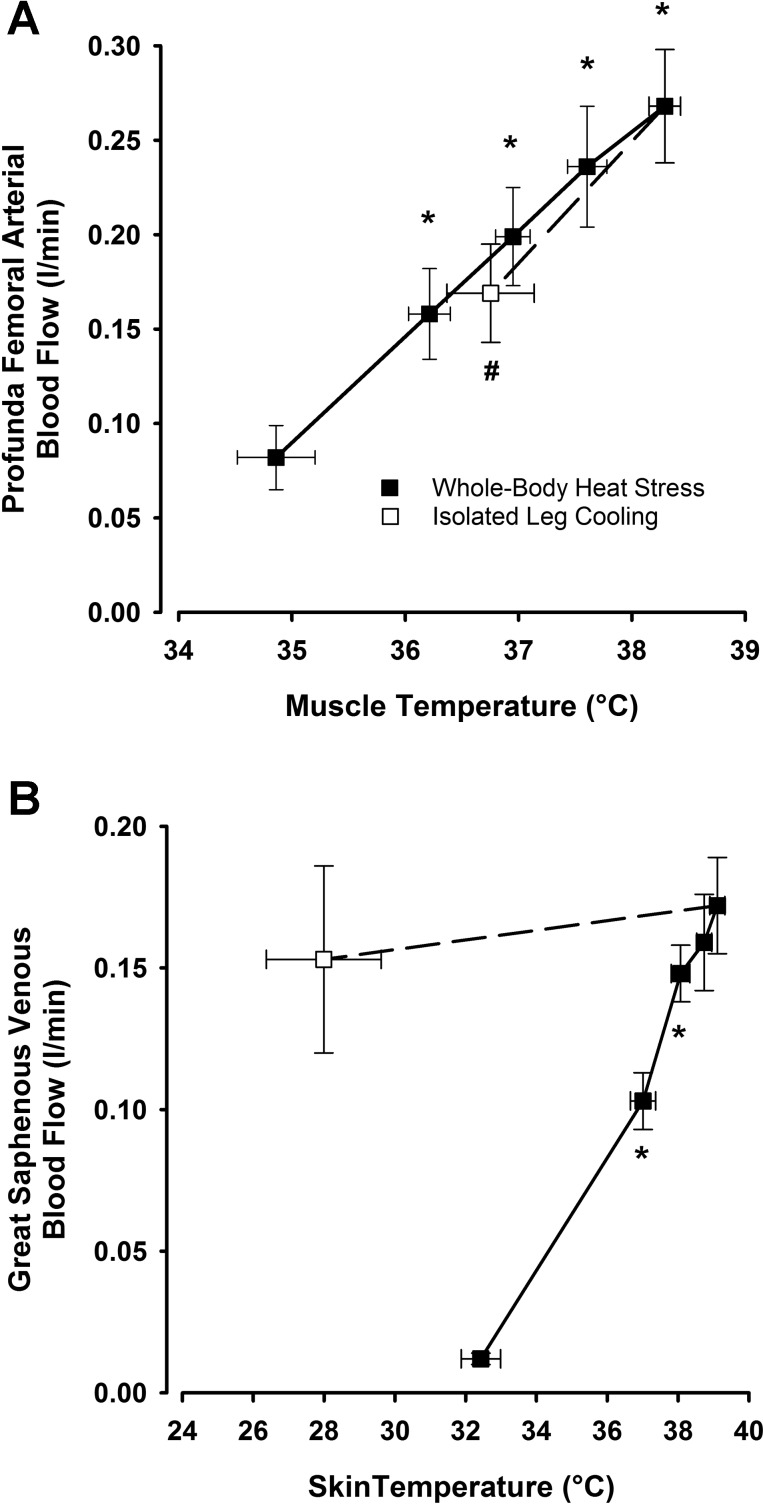
The influence of temperature on the hemodynamic adjustments to direct passive heat stress within the leg's major arterial and venous vessels and compartments remains unclear. Fifteen healthy young males were tested during exposure to either passive whole body heat stress to levels approaching thermal tolerance [core temperature (Tc) + 2°C; study 1; n = 8] or single leg heat stress (Tc + 0°C; study 2; n = 7). Whole body heat stress increased perfusion and decreased oscillatory shear index in relation to the rise in leg temperature (Tleg) in all three major arteries supplying the leg, plateauing in the common and superficial femoral arteries before reaching severe heat stress levels. Isolated leg heat stress increased arterial blood flows and shear patterns to a level similar to that obtained during moderate core hyperthermia (Tc + 1°C). Despite modest increases in great saphenous venous (GSV) blood flow (0.2 l/min), the deep venous system accounted for the majority of returning flow (common femoral vein 0.7 l/min) during intense to severe levels of heat stress. Rapid cooling of a single leg during severe whole body heat stress resulted in an equivalent blood flow reduction in the major artery supplying the thigh deep tissues only, suggesting central temperature-sensitive mechanisms contribute to skin blood flow alone. These findings further our knowledge of leg hemodynamic responses during direct heat stress and provide evidence of potentially beneficial vascular alterations during isolated limb heat stress that are equivalent to those experienced during exposure to moderate levels of whole body hyperthermia.
Keywords: heat stress; hemodynamics; leg blood flow.
Copyright © 2016 the American Physiological Society.
Figures
Similar articles
-
Hemodynamic responses to heat stress in the resting and exercising human leg: insight into the effect of temperature on skeletal muscle blood flow.Am J Physiol Regul Integr Comp Physiol. 2011 Mar;300(3):R663-73. doi: 10.1152/ajpregu.00662.2010. Epub 2010 Dec 22. Am J Physiol Regul Integr Comp Physiol. 2011. PMID: 21178127 Free PMC article.
-
Local temperature-sensitive mechanisms are important mediators of limb tissue hyperemia in the heat-stressed human at rest and during small muscle mass exercise.Am J Physiol Heart Circ Physiol. 2015 Jul 15;309(2):H369-80. doi: 10.1152/ajpheart.00078.2015. Epub 2015 May 1. Am J Physiol Heart Circ Physiol. 2015. PMID: 25934093 Free PMC article.
-
Regional thermal hyperemia in the human leg: Evidence of the importance of thermosensitive mechanisms in the control of the peripheral circulation.Physiol Rep. 2021 Aug;9(15):e14953. doi: 10.14814/phy2.14953. Physiol Rep. 2021. PMID: 34350727 Free PMC article.
-
Cardiovascular function in the heat-stressed human.Acta Physiol (Oxf). 2010 Aug;199(4):407-23. doi: 10.1111/j.1748-1716.2010.02119.x. Epub 2010 Mar 24. Acta Physiol (Oxf). 2010. PMID: 20345414 Free PMC article. Review.
-
Cerebral changes during exercise in the heat.Sports Med. 2003;33(1):1-11. doi: 10.2165/00007256-200333010-00001. Sports Med. 2003. PMID: 12477374 Review.
Cited by
-
Mouse liver is more resistant than skeletal muscle to heat-induced apoptosis.Cell Stress Chaperones. 2021 Jan;26(1):275-281. doi: 10.1007/s12192-020-01163-4. Epub 2020 Sep 3. Cell Stress Chaperones. 2021. PMID: 32880059 Free PMC article.
-
Heat, Hydration and the Human Brain, Heart and Skeletal Muscles.Sports Med. 2019 Feb;49(Suppl 1):69-85. doi: 10.1007/s40279-018-1033-y. Sports Med. 2019. PMID: 30671905 Free PMC article. Review.
-
Acute limb heating improves macro- and microvascular dilator function in the leg of aged humans.Am J Physiol Heart Circ Physiol. 2017 Jan 1;312(1):H89-H97. doi: 10.1152/ajpheart.00519.2016. Epub 2016 Nov 11. Am J Physiol Heart Circ Physiol. 2017. PMID: 27836894 Free PMC article.
-
Thermotherapy reduces blood pressure and circulating endothelin-1 concentration and enhances leg blood flow in patients with symptomatic peripheral artery disease.Am J Physiol Regul Integr Comp Physiol. 2016 Aug 1;311(2):R392-400. doi: 10.1152/ajpregu.00147.2016. Epub 2016 Jun 22. Am J Physiol Regul Integr Comp Physiol. 2016. PMID: 27335279 Free PMC article. Clinical Trial.
-
The effect of a 4-week, remotely administered, post-exercise passive leg heating intervention on determinants of endurance performance.Eur J Appl Physiol. 2024 Dec;124(12):3631-3647. doi: 10.1007/s00421-024-05558-4. Epub 2024 Jul 25. Eur J Appl Physiol. 2024. PMID: 39052044 Free PMC article. Clinical Trial.
References
-
- Abraham P, Leftheriotis G, Desvaux B, Saumet M, Saumet JL. Venous return in lower limb during heat stress. Am J Physiol Heart Circ Physiol 267: H1337–H1340, 1994. - PubMed
-
- Anderson FA, Spencer FA. Risk factors for venous thromboembolism. Circulation 107: 9–16, 2003. - PubMed
-
- Brengelmann GL, Wyss C, Rowell LB. Control of forearm skin blood flow during periods of steadily increasing skin temperature. J Appl Physiol 35: 77–84, 1973. - PubMed
MeSH terms
LinkOut - more resources
Full Text Sources
Other Literature Sources
Medical