. 2016 Jan 29;351(6272):aad2197.
doi: 10.1126/science.aad2197. Epub 2016 Jan 28.

A zebrafish melanoma model reveals emergence of neural crest identity during melanoma initiation

Affiliations

A zebrafish melanoma model reveals emergence of neural crest identity during melanoma initiation

Charles K Kaufman et al. Science. .

Abstract

The "cancerized field" concept posits that cancer-prone cells in a given tissue share an oncogenic mutation, but only discreet clones within the field initiate tumors. Most benign nevi carry oncogenic BRAF(V600E) mutations but rarely become melanoma. The zebrafish crestin gene is expressed embryonically in neural crest progenitors (NCPs) and specifically reexpressed in melanoma. Live imaging of transgenic zebrafish crestin reporters shows that within a cancerized field (BRAF(V600E)-mutant; p53-deficient), a single melanocyte reactivates the NCP state, revealing a fate change at melanoma initiation in this model. NCP transcription factors, including sox10, regulate crestin expression. Forced sox10 overexpression in melanocytes accelerated melanoma formation, which is consistent with activation of NCP genes and super-enhancers leading to melanoma. Our work highlights NCP state reemergence as a key event in melanoma initiation.


Figures

Figure 1
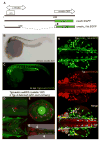
Figure 1. The crestin promoter/enhancer drives neural crest-specific gene expression
(A) Prototypical crestin retrotransposon locus with predicted ORF, LTR-like, and U3-like promoter regions. Locations of 4.5 kb and 1 kb segments used for crestin:EGFP constructs (white box/promoter arrow indicate β-globin gene minimal promoter). (B) Endogenous expression pattern of crestin transcript by ISH (purple staining) at 24 hpf marks developing and migrating neural crest cells. (C) This expression pattern (green) is recapitulated by a stable Tg(crestin:EGFP) embryo at 24 hpf. (D–G) Genetic lineage tracing of cells that express crestin (Tg(crestin:creERt2;crystallin:YFP) X Tg(−3.5ubi:loxP-GFP-loxP-mCherry) marks multiple neural crest lineages (red cells) including melanocytes (bracket) on the dorsum (D) and the eye (E) (72 hpf), (F) jaw cartilage (ventral view, 5 dpf), and (G) glial cells of the lateral line (arrows, dorsal view posterior to the yolk, 72 hpf). (H) Tg(crestin:EGFP) expression overlaps significantly with a sox10:mCh transgene (confocal image, dorsal view over yolk, 24 hpf).
Figure 2
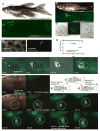
Figure 2. Tg(crestin:EGFP) specifically marks melanoma tumors and precursor lesions
(A) Spontaneously arising tumors in p53/BRAF/crestin:EGFP zebrafish express EGFP (brackets) whereas the remainder of the animal is negative. (B–C) Scales expressing crestin:EGFP from precursor, non-raised regions (arrow, lower panel) were plucked, photographed (C, left and middle panel), and subjected to ISH for crestin transcript (C, right panel). Note the concordance of EGFP (green) and crestin transcript (purple, dotted outlines, scales curl during ISH procedure, indicated by the curved arrow, observed in 5/5 scales). (C, lower right) crestin:EGFP negative scales are negative for crestin ISH staining (observed in 7/7 tested scales). (D) Example of a single crestin:EGFP (+) cell in p53/BRAF background. (E) Cohorts of p53/BRAF/crestin:EGFP zebrafish were tracked over time for the appearance of crestin:EGFP (+) patches and tumors, with crestin:EGFP (+) cells/patches (green line) identifiable prior to raised melanoma tumors (black line). (F) Example of an EGFP (+) preclinical patch tracked over time (6, 9, 11.5, 17 weeks) as it expands into a clinically apparent melanoma tumor. (G) Scale autotransplant and expansion of crestin:EGFP (+) patch of cells. At Day 0, the recipient site is free of crestin:EGFP (+) cells pre-scale transplant, but immediately following transplant of a single scale (post-scale transplant), the patch of EGFP (+) cells is apparent (white circle). This patch expands outward, and even upon removal of the original transplanted scale after the day 33 photograph, EGFP (+) cells remain in place and continue to expand. Same magnification and size of white circle in each image.
Figure 3
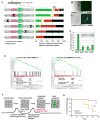
Figure 3. Reemergence of neural crest progenitor identity in melanoma initiation
(A) Mutation of key neural crest transcription factor binding sites in the 296 bp crestin element, including sox10, tfap2, and an E-box for myc or mitf, substantially reduces neural crest EGFP expression at 24 hpf, whereas mutation of the predicted pax3 site does not alter expression. Coinjection of a ubiquitous ubi:mCh transgene confirmed successful injection for the >80 independently injected F0 embryos analyzed for each construct. Scales from p53/BRAF/Na/MiniCoopR/crestin:EGFP adult zebrafish with (B) and without (C) EGFP (+) cells were collected, and total RNA isolated for microarray analysis. (D) Quantitative RT-PCR of crestin:EGFP (+) versus (−) scales reveals enrichment of neural crest (crestin, dlx2a, sox10) and melanoma marker expression (crestin, mia, sox10). (E) GSEA analysis shows a positive association between crestin:EGFP (+) patch-enriched genes and neural crest-expressed genes in zebrafish (left panel) and in human ES-derived neural crest cells (right panel). (F) Model for the importance of reemergence of neural crest progenitor (NCP) state through SE activation as an essential step in melanoma initiation. The acquisition of genetic lesions in normal tissue leads to oncogene activation (BRAFV600E) and tumor suppressor loss (p53−/−) and represents an initial barrier that generates a cancerized field from which rare clones (green) overcome the additional barrier of achieving a NCP state to initiate melanoma formation and then tumor expansion. Favoring reemergence of the neural crest progenitor state would then increase melanoma formation, and strengthening this barrier to inhibit adoption of the crestin (+) NCP state would block melanoma initiation (G) Misexpression of the NCP transcription factor sox10 accelerates melanoma onset compared to controls in p53/BRAF/Na zebrafish rescued with the MiniCoopR construct.
Figure 4
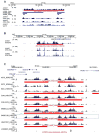
Figure 4. A super-enhancer (SE) signature in zebrafish and human melanoma
(A) ChIP-Seq for the H3K27Ac histone mark (top row) in a crestin:EGFP (+) zebrafish melanoma cell line (zcrest 1) reveals enriched peaks, identified as a SE (red bar), at a representative crestin locus. Sequences of crestin_4.5kb, crestin_1kb, and crestin_296bp shown with blue horizontal bars. ATAC-Seq on two zebrafish melanoma lines (zcrest 1 and zcrest 2) identifies open chromatin coincident with the H3K27Ac marks at crestin loci. ChIP-Seq for Sox10 shows enrichment across the crestin locus (bottom row) in zcrest 1 cells. (B) ChIP-Seq for the H3K27Ac histone mark (top row) on the zcrest 1 line identifies robust enrichment and a SE at sox10 (red bar). ATAC-Seq identifies corresponding regions of open chromatin (rows 2 and 3). (C) ChIP-Seq for the H3K27Ac mark on multiple SOX10-expressing melanoma lines (A375, CJM, COLO679, SKMEL2, SKMEL30, UACC257) and a rare SOX10-negative melanoma line (LOXIMVI). Robust peaks corresponding to SE’s (red bars) are identified in all lines, except the SOX10-negative LOXIMVI line. Published H3K27Ac ChIP-Seq data from ES-derived human neural crest cells (NCC’s) reveals a similar SE pattern. ChIP-Seq for H3K4Me1, an enhancer mark, on a representative melanoma line, A375 (row 2), identifies regions corresponding to the H3K27Ac marks. (D) H3K27Ac signal is robust at the DLX2 locus in melanoma cell lines not expressing the melanocyte differentiation genes TYR and DCT (blue box), in human NCC’s, and in the SOX10-negative LOVIMVI melanoma line. Human genomic track images generated at http://genome.ucsc.edu. (E) High relative H3K27ac signal at SOX10 (upper panel) and DLX2 (lower panel) identifies SE’s (presence = red/orange bar, absence = blue bars) and is largely enriched in melanomas and human NCC’s compared to 66 normal and 18 cancer cell types.

Comment in

References

    1. Slaughter DP, Southwick HW, Smejkal W. Field cancerization in oral stratified squamous epithelium; clinical implications of multicentric origin. Cancer. 1953;6:963–968. - PubMed
    1. Mort RL, Jackson IJ, Patton EE. The melanocyte lineage in development and disease. nrs.harvard.edu. - PubMed
    1. T. C. G. A. R. Network. Comprehensive molecular profiling of lung adenocarcinoma. Nature. 2015;511:543–550. - PMC - PubMed
    1. Lo JA, Fisher DE. The melanoma revolution: from UV carcinogenesis to a new era in therapeutics. Science. 2014;346:945–949. - PMC - PubMed
    1. Patton EE, et al. BRAF Mutations Are Sufficient to Promote Nevi Formation and Cooperate with p53 in the Genesis of Melanoma. Current Biology. 2005;15:249–254. - PubMed

Publication types

MeSH terms

Associated data