. 2016 Jan 29;351(6272):aad3867.
doi: 10.1126/science.aad3867.

Translation from the 5' untranslated region shapes the integrated stress response

Affiliations

Translation from the 5' untranslated region shapes the integrated stress response

Shelley R Starck et al. Science. .

Abstract

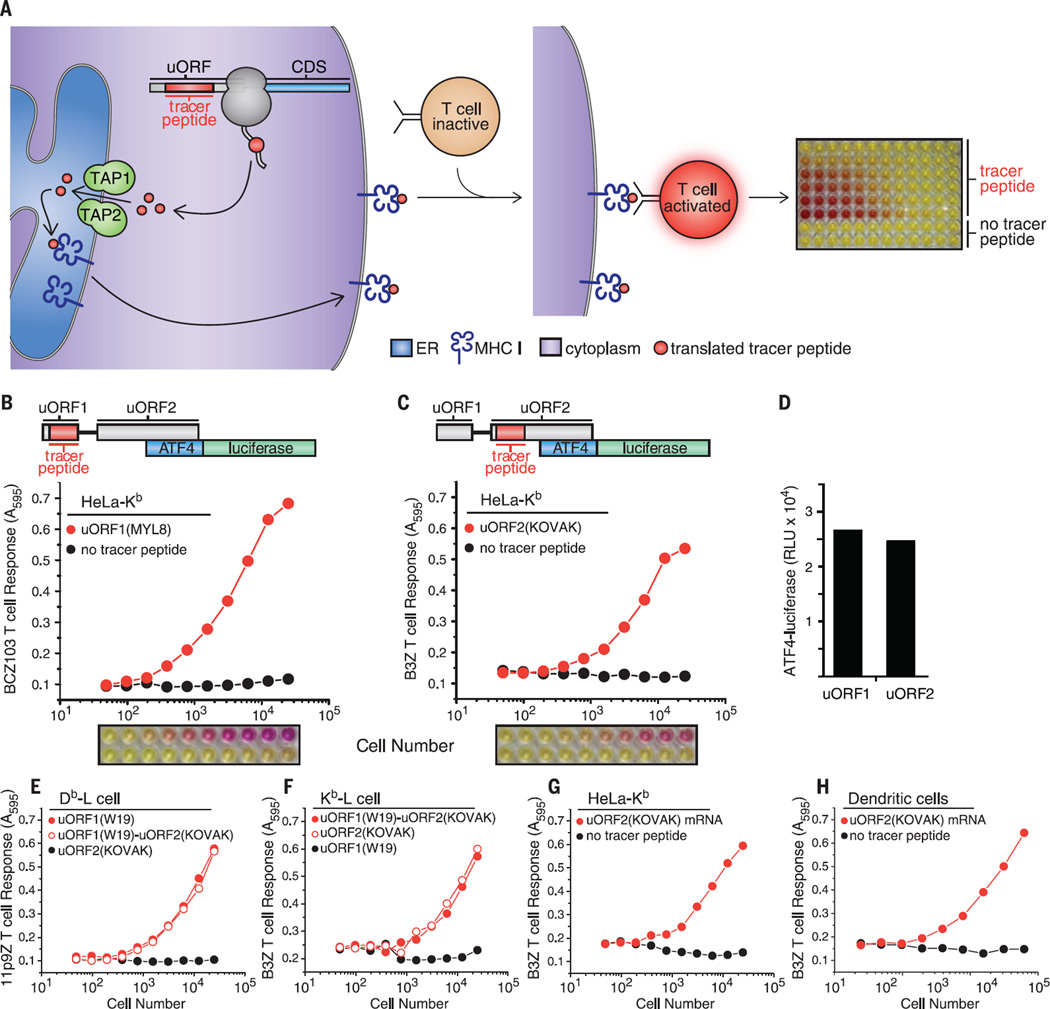
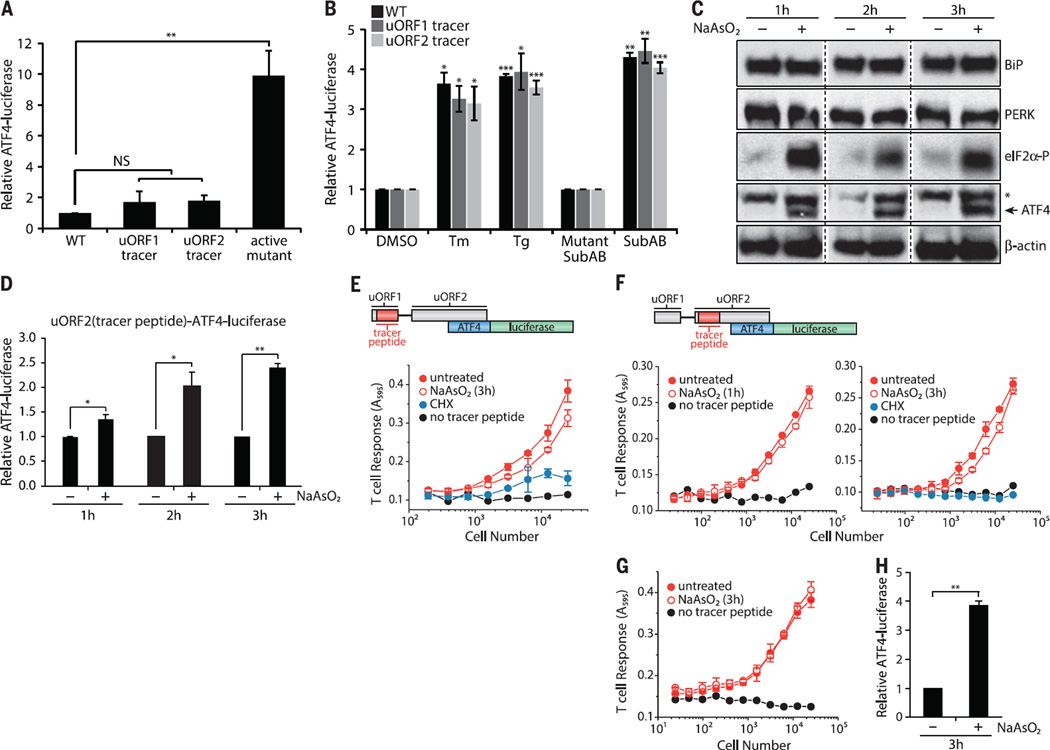
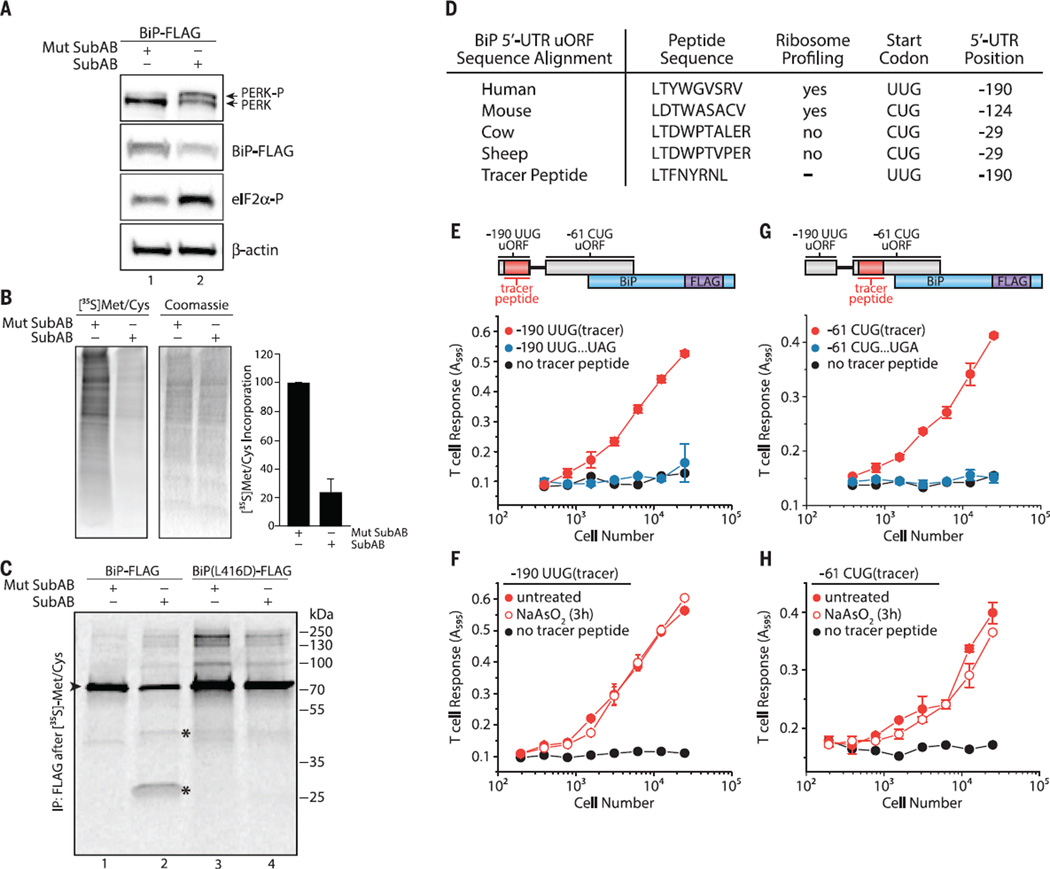
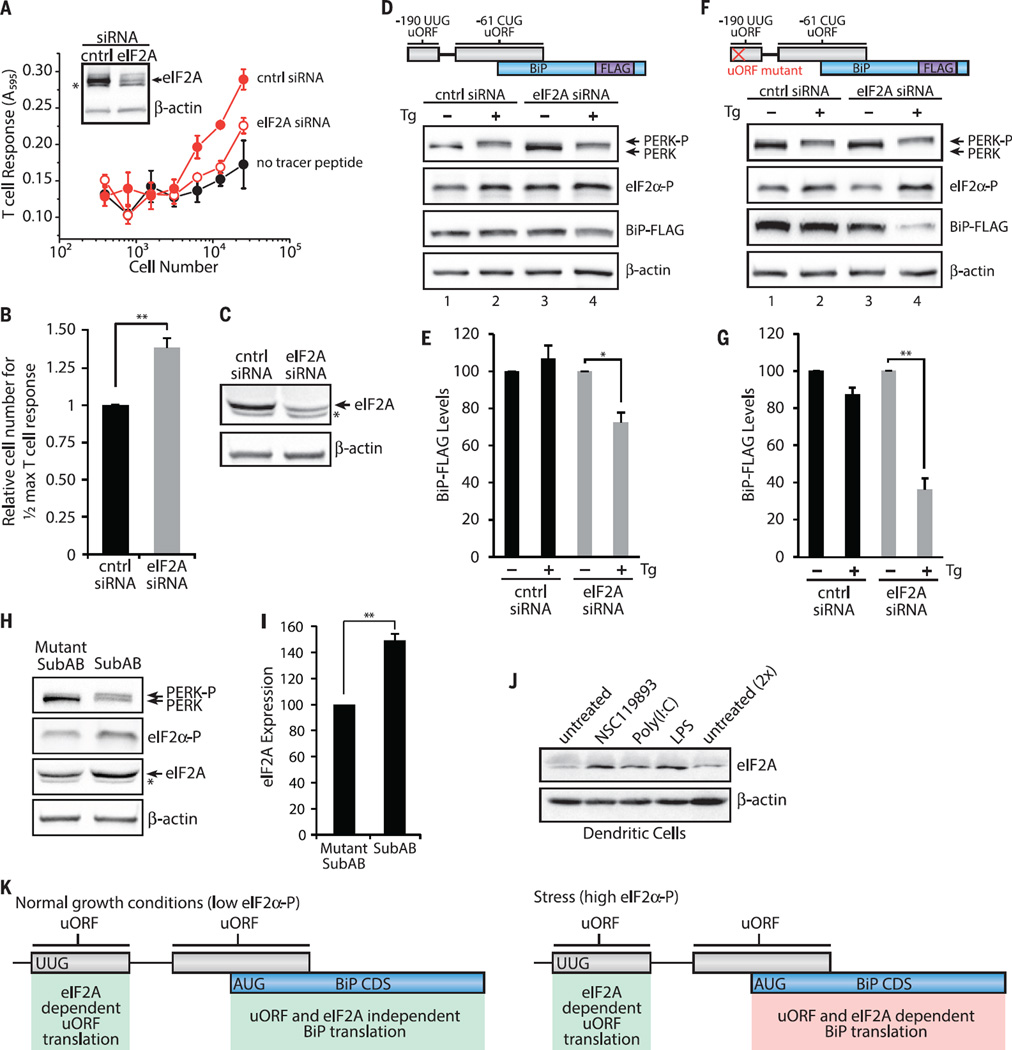
Translated regions distinct from annotated coding sequences have emerged as essential elements of the proteome. This includes upstream open reading frames (uORFs) present in mRNAs controlled by the integrated stress response (ISR) that show "privileged" translation despite inhibited eukaryotic initiation factor 2-guanosine triphosphate-initiator methionyl transfer RNA (eIF2·GTP·Met-tRNA(i )(Met)). We developed tracing translation by T cells to directly measure the translation products of uORFs during the ISR. We identified signature translation events from uORFs in the 5' untranslated region of binding immunoglobulin protein (BiP) mRNA (also called heat shock 70-kilodalton protein 5 mRNA) that were not initiated at the start codon AUG. BiP expression during the ISR required both the alternative initiation factor eIF2A and non-AUG-initiated uORFs. We propose that persistent uORF translation, for a variety of chaperones, shelters select mRNAs from the ISR, while simultaneously generating peptides that could serve as major histocompatibility complex class I ligands, marking cells for recognition by the adaptive immune system.


Figures

Fig. 1
Fig. 1. 3T reveals the translational capacity of uORFs in 5′ UTRs
(A) Schematic of 3T: A tracer peptide inserted into noncoding regions of the 5′ UTR, such as uORFs, followed by translation, peptide processing, and transport by TAP into the ER for loading onto MHC I molecules. The tracer peptide–MHC I complex transits to the cell surface and is recognized by a T cell hybridoma. Recognition of the tracer peptide–MHC I complex on the cell surface activates the T cell hybridoma, which is measured by a colorimetric assay and indicates the presence of a uORF translation product. Schematics of the ATF4 5′ UTR with nested tracer peptides. Plotted T cell responses and colorimetric readout of the 3Tassay from tracer peptides generated from transfection of HeLa-Kb cells with (B) uORF1(MYL8)–ATF4-luciferase detected with the BCZ103 T cell hybridoma and (C) uORF2(KOVAK)–ATF4-luciferase detected with the B3Z T cell hybridoma with simultaneous detection of ATF4-luciferase expression (D). T cell responses from tracer peptides generated from uORF1(WI9)–ATF4-luciferase, uORF1 (WI9)-uORF2(KOVAK)–ATF4-luciferase, or uORF2(KOVAK)–ATF4-luciferase transfected (E) Db-L cells detected with the 11p9Z T cell hybridoma or (F) Kb-L cells detected with the B3Z T cell hybridoma. 3T responses from uORF2(KOVAK)–ATF4-luciferase (detected with the B3Z T cell hybridoma) generated from mRNA transfection of HeLa-Kb cells (G) and primary bone marrow–derived dendritic cells (H). T cell responses are representative of n ≥ 3. A595, absorption at 595 nm.
Fig. 2
Fig. 2. uORFs are expressed during stress-induced expression of ATF4
(A) ATF4-luciferase levels during normal growth conditions were measured from HeLa-Kb cells transfected with wild type–ATF4-luciferase, ATF4-luciferase constructs with tracer peptide insertions [uORF1(MYL8) or uORF2(KOVAK) tracer peptides], or a constitutively active ATF4-luciferase variant (means ± SEM; n = 3 to 4). (B) Stress-induced ATF4-luciferase levels were measured from HeLa-Kb cells transfected with wild type–ATF4-luciferase and ATF4-luciferase constructs with tracer peptide insertions [uORF1(MYL8) or uORF2(KOVAK) tracer peptides] and after treatments with tunicamycin (Tm) (1 µg/ml), Tg (1 µM), or Mutant SubAB or SubAB (0.2 µg/ml) for 6 hours (means ± SEM; n = 3 to4). HeLa-Kb cells from independent tracer peptide DNA transfections were treated with NaAsO2 (10 µM) for 1 to 3 hours and analyzed by immunoblot (n = 3; *nonspecific ATF4-specific antibody signal) (C) or for luciferase expression from uORF2(KOVAK)–ATF4-luciferase–transfected cells (means ± SD; n = 3 to 4) (D). Tracer peptide expression was measured from HeLa-Kb cells transfected with either uORF1(MYL8)–ATF4 luciferase (E) or uORF2(KOVAK)–ATF4 luciferase (F) after treatment with NaAsO2 (10 µM) (means ± SD from two biological replicates are representative of n = 3). Stable uORF2(KOVAK)–ATF4-luciferase HeLa-Kb cells were treated for 3 hours with NaAsO2 (10 µM) and assayed for uORF2(KOVAK) tracer peptide expression (G) (means ± SD from two biological replicates are representative of n = 3) or for ATF4-luciferase expression (H) (means ± SEM; n = 3). Statistical significance was evaluated with the unpaired t test (NS, not significant; *P < 0.05; **P < 0.01; ***P < 0.001).
Fig. 3
Fig. 3. The BiP 5′ UTR harbors non–AUG-initiated uORFs constitutively expressed during the ISR
Cells treated with Mutant SubAB or SubAB (0.2 µg/ml) for 2 hours in HeLa-Kb cells were analyzed by (A) immunoblot or (B) [35S]Met-Cys pulse-labeled to measure total protein synthesis (means ± SEM; n = 4). (C) SubAB-treated HeLa-Kb cells (1 hour) followed by [35S]Met-Cys pulse-labeling (1 hour) and BiP-FLAG immunoprecipitation (►is full-length BiP and * indicates BiP cleavage products; data representative of n=2). (D) Amino acid sequence alignment of the BiP 5′ UTR −190 uORF with non-AUG start codons. (E) Schematic of the BiP 5′ UTR with the tracer peptide LYL8 at the −190 UUG uORF. Translation of the −190 UUG uORF was measured from−190 UUG uORF tracer peptide BiP-FLAG–transfected HeLa-Kb cells detected with the BCZ103 T cell hybridoma and compared with cells transfected with an identical construct containing an in-frame UAG stop codon inserted in the middle of the tracer peptide (see fig. S9) or transfected with a no-tracer peptide construct (BiP-FLAG) and (F) after treatment with NaAsO2 (10 µM) for 3 hours (means ± SD from two biological replicates and are representative of n = 3). (G) Schematic of the BiP 5′ UTR with the nested tracer peptide KOVAK in the −61 CUG uORF. Translation of the −61 CUG uORF was measured from −61 CUG uORF tracer peptide BiP-FLAG–transfected HeLa-Kb cells detected with the B3Z T cell hybridoma and compared with cells transfected with an identical construct containing an in-frame UGA stop codon inserted after the −61 CUG uORF start codon but before the tracer peptide (see fig. S9) or transfected with a no-tracer peptide construct (BiP-FLAG) and (H) after treatment with NaAsO2 (10 µM) for 3 hours (data are presented as means ± SD of two biological replicates and are representative of n = 3).
Fig. 4
Fig. 4. eIF2A and 5′ UTR uORFs are required for sustained BiP expression during the ISR
(A) Translation of the −190 UUG uORF from −190 UUG uORF tracer peptide (LYL8) BiP-FLAG–transfected HeLa-Kb cells after 48 hours siRNA knockdown detected with the BCZ103 T cell hybridoma and compared with cells transfected with a no-tracer peptide construct (data are presented as means ± SD of two biological replicates and are representative of n = 4). Inset shows an immunoblot for eIF2A knockdown and a β-actin loading control. (B) Relative number of cells required to achieve half-maximal T cell response for −190 UUG uORF expression with eIF2A siRNA knockdown (mean ± SEM; n = 4). Expression of BiP-FLAG analyzed by immunoblot from BiP-FLAG (D and E) or uORF mutant BiP-FLAG (F and G) transfected HeLa-Kb cells after 48 hours of siRNA knockdown (C) and treatment with DMSO or Tg (1 µM) for 3 hours (n = 3). BiP levels are presented relative to untreated for each siRNA. (H and I) HeLa-Kb cells treated with Mut SubAB or SubAB (0.2 µg/ml) for 2 hours and analyzed by immunoblot for eIF2A expression (*nonspecific anti-eIF2A antibody signal) (means ± SEM; n = 3). (J) Primary bone marrow–derived dendritic cells analyzed by immunoblot for eIF2A expression after treatment with NSC119893 (50 µM), poly(I:C) (1 µg/ml), or LPS (1 µg/ml) for 3 hours (n=2). (K) Working model for uORF translation regulation of BiP CDS expression. During normal growth conditions, BiP CDS expression is not dependent on uORF translation and eIF2A. Stress up-regulates eIF2α-P levels, leads to elevated eIF2A levels, and leads to constitutive uORF translation, which positively regulates BiP CDS expression. Statistical significance was evaluated with the unpaired t test (*P < 0.05; **P < 0.01)
Fig. 5
Fig. 5. Peptides translated from uORFs and other RNAs during the ISR are predicted to be MHC I peptides
(A) HLA epitope (human MHC I) prediction from translation of the BiP 5′ UTR −190 UUG uORF using the immune epitope database (IEDB) analysis resource consensus tool (94). (B) Schematic for TAP diffusion [TAP1(GFP)-TAP2 complex] in the ER in the presence or absence of peptides. (C) Meljuso cells stably expressing TAP1-GFP (62) treated for 1 hour with NSC119893 (25 µM) or CHX (50 µg/ml) and labeled with 35S (n = 3) or (D) HeLa-Kb cells treated for 8 hours with bruceantin (100 nM); NSC119893 (50 µM, replenished every 2 hours); or CHX 100 µg/ml and analyzed by immunoblot (n = 3). (E) Meljuso cells stably expressing TAP1-GFP were treated with either NSC119893 or CHX for 1 hour and imaged using fluorescence confocal microscopy for lateral mobility of TAP with treatment (means ± SEM; n = 4 to 7). (F) uORFs predicted from ribosome profiling of chaperone mRNAs (33) generate peptides predicted to be HLA epitopes using the IEDB resource consensus tool (94). Statistical significance was evaluated with the unpaired t test (***P < 0.001).

Comment in

Similar articles

Cited by

References

    1. Walter P, Ron D. The unfolded protein response: From stress pathway to homeostatic regulation. Science. 2011;334:1081–1086. pmid: 22116877. - PubMed
    1. Shi Y, et al. Identification and characterization of pancreatic eukaryotic initiation factor 2 alpha-subunit kinase, PEK, involved in translational control. Mol. Cell. Biol. 1998;18:7499–7509. pmid: 9819435. - PMC - PubMed
    1. Harding HP, Zhang Y, Ron D. Protein translation and folding are coupled by an endoplasmic-reticulum-resident kinase. Nature. 1999;397:271–274. pmid: 9930704. - PubMed
    1. Galabru J, Katze MG, Robert N, Hovanessian AG. The binding of double-stranded RNA and adenovirus VAI RNA to the interferon-induced protein kinase. Eur. J. Biochem. 1989;178:581–589. pmid: 2912723. - PubMed
    1. Meurs E, et al. Molecular cloning and characterization of the human double-stranded RNA-activated protein kinase induced by interferon. Cell. 1990;62:379–390. pmid: 1695551. - PubMed

Publication types

MeSH terms