. 2016 Jun 2;44(10):4595-609.
doi: 10.1093/nar/gkw042. Epub 2016 Jan 28.

Pluralistic and stochastic gene regulation: examples, models and consistent theory

Affiliations

Pluralistic and stochastic gene regulation: examples, models and consistent theory

Elisa N Salas et al. Nucleic Acids Res. .

Abstract

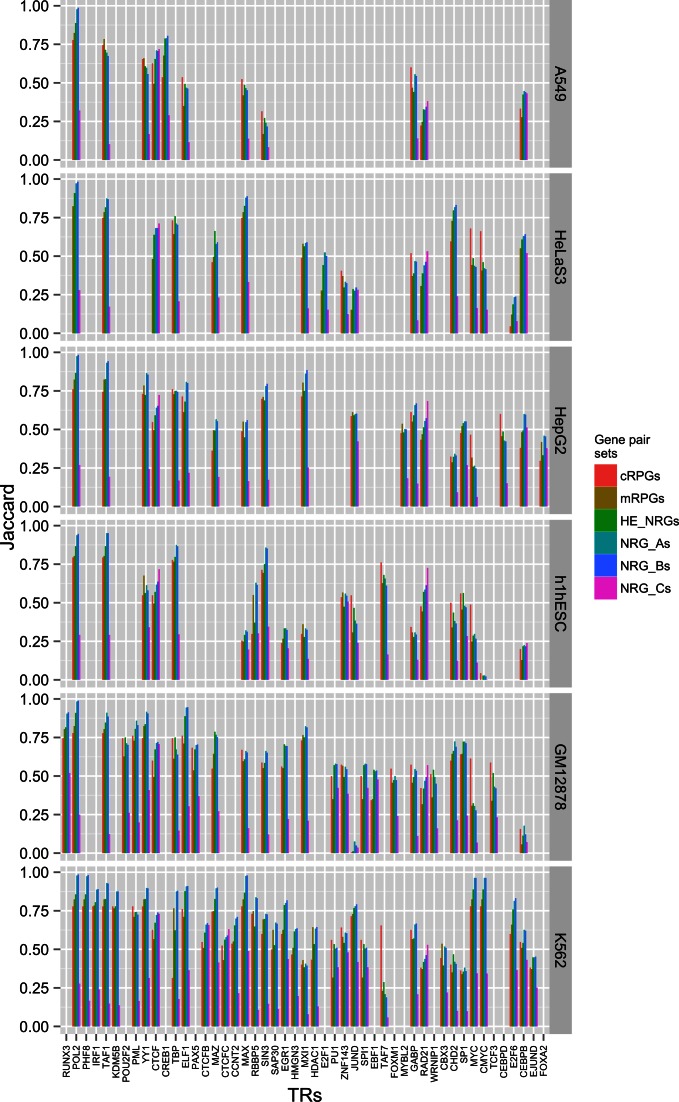
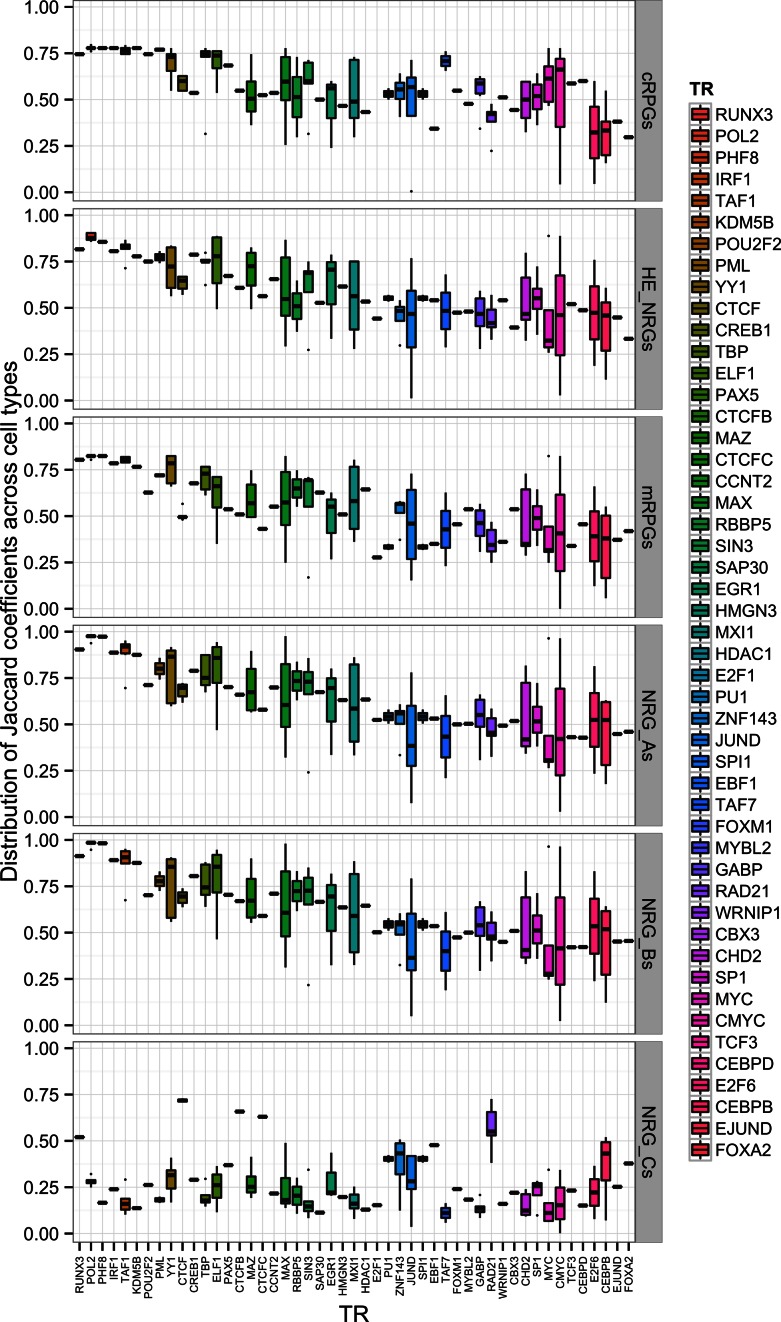
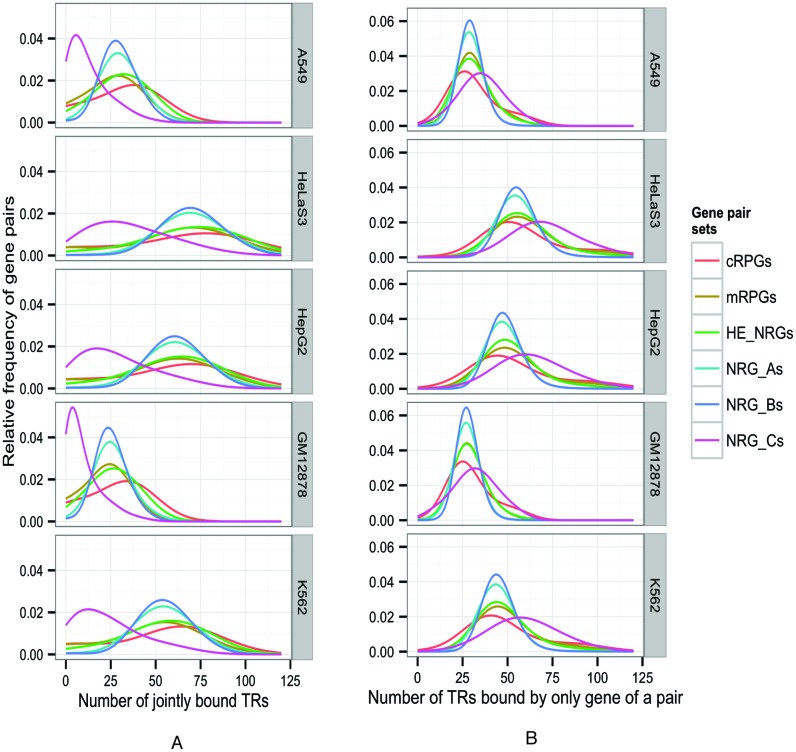
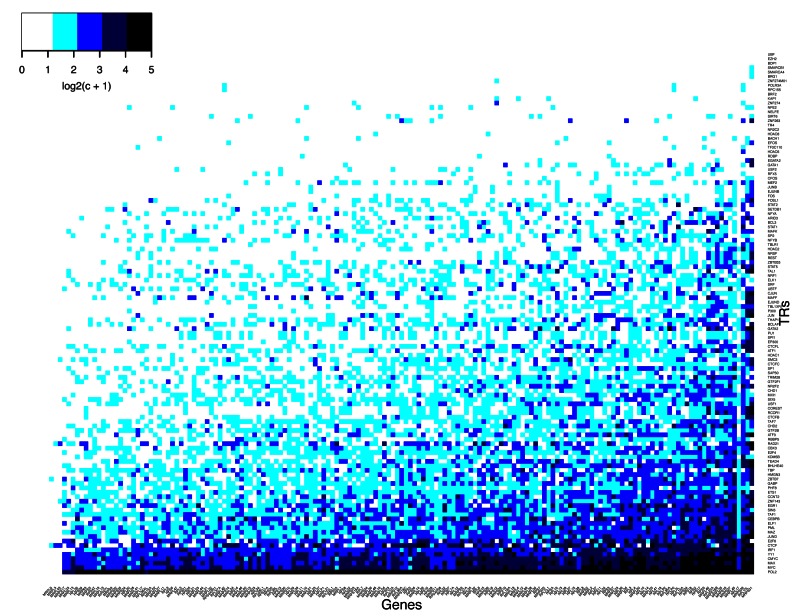
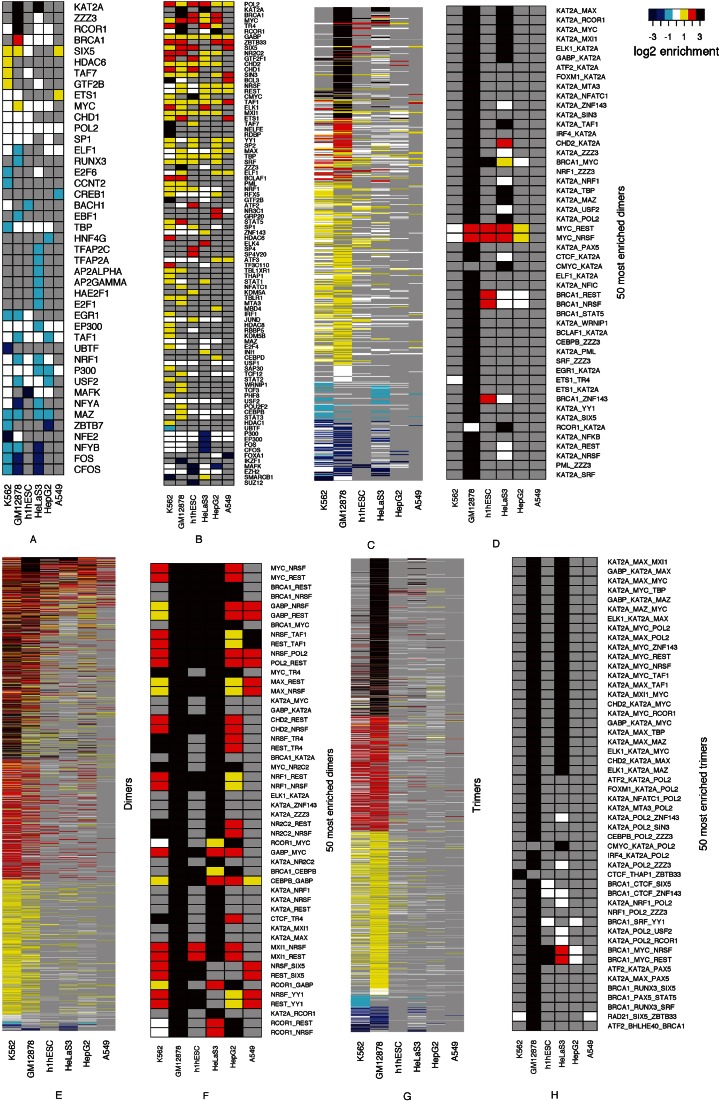
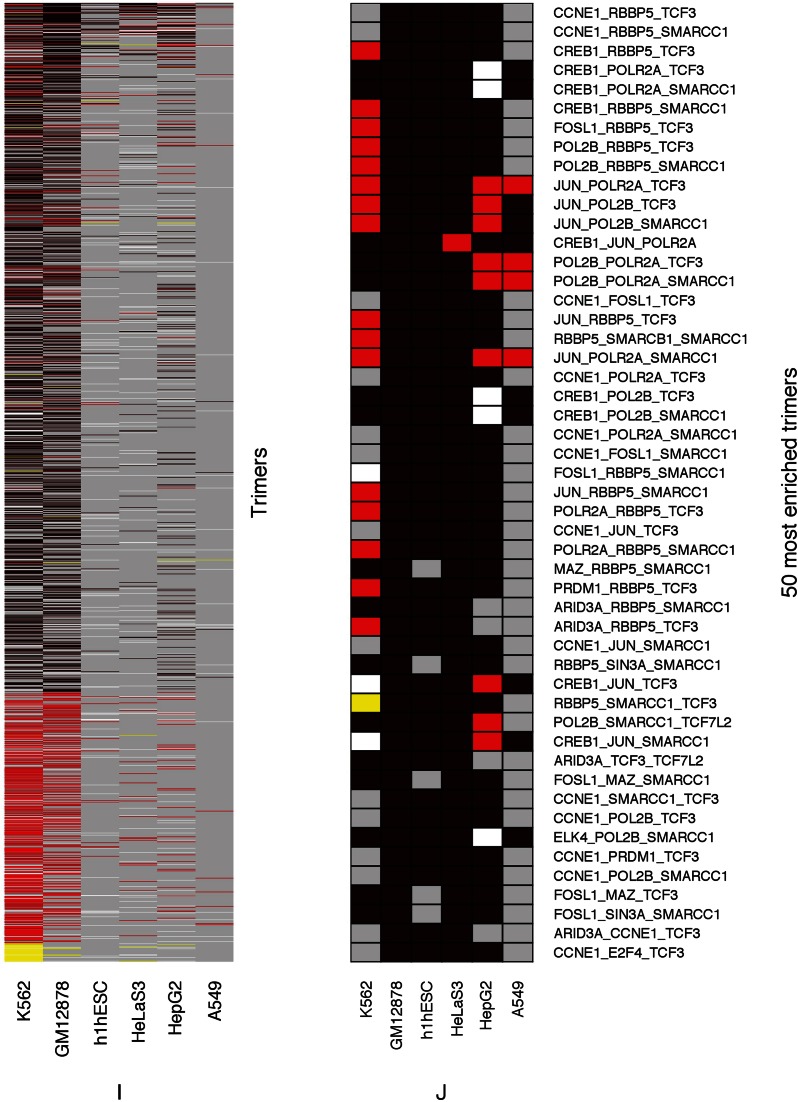
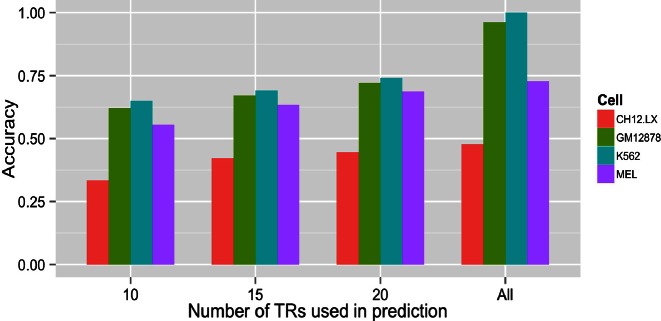
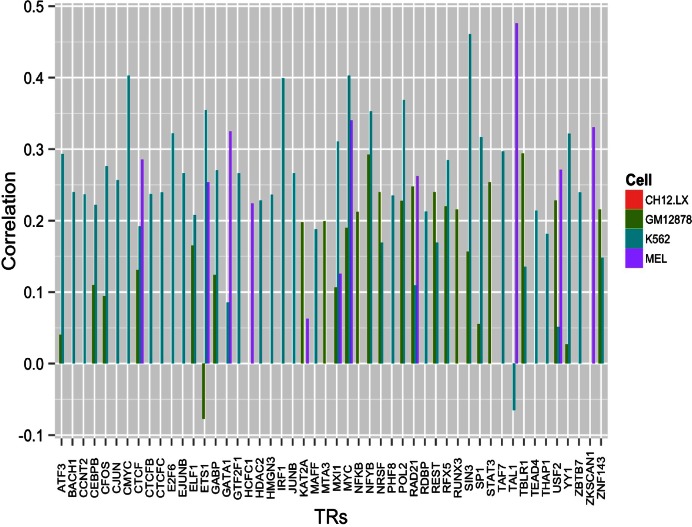
We present a theory of pluralistic and stochastic gene regulation. To bridge the gap between empirical studies and mathematical models, we integrate pre-existing observations with our meta-analyses of the ENCODE ChIP-Seq experiments. Earlier evidence includes fluctuations in levels, location, activity, and binding of transcription factors, variable DNA motifs, and bursts in gene expression. Stochastic regulation is also indicated by frequently subdued effects of knockout mutants of regulators, their evolutionary losses/gains and massive rewiring of regulatory sites. We report wide-spread pluralistic regulation in ≈800 000 tightly co-expressed pairs of diverse human genes. Typically, half of ≈50 observed regulators bind to both genes reproducibly, twice more than in independently expressed gene pairs. We also examine the largest set of co-expressed genes, which code for cytoplasmic ribosomal proteins. Numerous regulatory complexes are highly significant enriched in ribosomal genes compared to highly expressed non-ribosomal genes. We could not find any DNA-associated, strict sense master regulator. Despite major fluctuations in transcription factor binding, our machine learning model accurately predicted transcript levels using binding sites of 20+ regulators. Our pluralistic and stochastic theory is consistent with partially random binding patterns, redundancy, stochastic regulator binding, burst-like expression, degeneracy of binding motifs and massive regulatory rewiring during evolution.


Figures

Figure 1.
Figure 1.
High reproducibility of ChIP-Seq peaks in pairs of co-expressed genes. Jaccard coefficients show reproducibility for the following sets of gene pairs: cRPGs (n = 4851 pairs); mRPGs (n = 3486); HE_NRGs (high-expression NRGs, n = 14 196, see Materials and Methods); NRG_A's (diverse gene pairs co-expressed with R ≥ 0.9, n = 17 846); NRG_B's (diverse gene pairs co-expressed with 0.9 > R ≥ 0.8, n = 759 316); and NRG_C's (a sample of independently expressed, diverse gene pairs, abs(R) < 0.1, n = 100 000). TR binding in NRG_C's is about 50% less reproducible than in co-expressed gene sets, indicating that a large portion of the binding events in gene regions is functional.
Figure 2.
Figure 2.
TRs bind with similar reproducibility in diverse human cells. Box plots show the distribution of Jaccard coefficients for individual TR. Sets of gene pairs are defined in Figure 1. In all co-expressed sets of gene pairs, over 25 TRs bind with a median reproducibility exceeding 0.5. In independently expressed gene pairs, reproducibility is only about 0.22, corresponding to the magnitude of nonspecific TR binding. Highly significant differences between co-expressed and independently expressed gene sets (P < 10−256, Wilcoxon–Mann–Whitney test) indicate that even those TRs, which bind in highly stochastic processes, may have biological roles.
Figure 3.
Figure 3.
(A). More TRs bind to both genes in co-expressed gene pairs than in independently expressed pairs (NRG_C's, max(P) < 10−32, Wilcoxon test). (B) Conversely, fewer TRs bind to only one gene in co-expressed gene pairs than in NRG_C's (max(P) < 10−32). The number of TRs that may be associated with co-regulation depends on the TRs mapped in a cell type. The number of TRs implicated in co-regulation ranges from 25 (in A549 and GM12878 cells) to over 50 (in HeLaS3, HepG2 and K562 cells).
Figure 4.
Figure 4.
Confirmation of tight RPG co-expression across a wide range of conditions and cell types. (A) Base 2 logarithms of transcript levels (horizontal axis) are shown in arbitrary but normalized units from 28,032 Affymetrix microarrays from the Genevestigator Database (30). Transcripts are over hundredfold more abundant in cRPGs than in mRPGs and also vary between families of RPGs. (B) Pearson correlation coefficients (R) for cRPG transcript levels for each RPG pair indicate that variations in transcript levels are reproducible and tightly correlated. The high median correlation of 0.7875 for all cRPGs is very likely due to co-regulation. High co-expression is in accordance with the earlier observation that only a small proportion of RP molecules are located outside the ribosome and the nucleolus (39).
Figure 5.
Figure 5.
Stochastic TR binding to DNA does not show evident master regulators. The unfiltered numbers of observed binding sites for individual TRs (c) in cytoplasmic and mitochondrial RPGs in human K562 cells. Statistical preferences for several TRs emerge despite considerable randomness, which is partly due to experimental noise. For scalability, log2(c +1) values are shown. Stochastic TR binding is also confirmed for all other analyzed human and mouse cell types (Supplementary Figure S3). The network of cRPG regulation also shows rich and highly variable binding of TRs to diverse cRPGs (Supplementary Figure S5).
Figure 6.
Figure 6.
cRPG regulatory binding events show highly specific and statistically significant patterns of enrichment or depletion of single transcriptional regulators, putative TR heterodimers and heterotrimers. Human cRPGs are compared to HE-NRGs and NRGs in separate panels. For single TRs, the significance of enrichment was assessed by the Wilcoxon–Mann–Whitney test, for dimers and trimers, by Fisher's Exact Test. Multiple test corrections were performed using Benjamini and Hochberg's False Discovery Rate (28). Numerical data are available in Supplementary Tables S4–S8. (A) Single TRs, cRPGs versus HE-NRGs. (B) Single TRs, cRPGs versus all NRGs. (C) Heterodimers, cRPGs versus HE-NRGs. (D) The 50 most highly enriched heterodimers, cRPGs versus HE-NRGs. (E) Heterodimers, cRPGs versus all NRGs. (F) The 50 most highly enriched heterodimers, cRPGs versus all NRGs. (G) Heterotrimers, cRPGs versus HE-NRGs. (H) The 50 most highly enriched heterotrimers, cRPGs versus HE-NRGs. (I) Heterotrimers, cRPGs versus all NRGs. (J) The 50 most highly enriched heterotrimers, cRPGs versus all NRGs.
Figure 6.
Figure 6.
cRPG regulatory binding events show highly specific and statistically significant patterns of enrichment or depletion of single transcriptional regulators, putative TR heterodimers and heterotrimers. Human cRPGs are compared to HE-NRGs and NRGs in separate panels. For single TRs, the significance of enrichment was assessed by the Wilcoxon–Mann–Whitney test, for dimers and trimers, by Fisher's Exact Test. Multiple test corrections were performed using Benjamini and Hochberg's False Discovery Rate (28). Numerical data are available in Supplementary Tables S4–S8. (A) Single TRs, cRPGs versus HE-NRGs. (B) Single TRs, cRPGs versus all NRGs. (C) Heterodimers, cRPGs versus HE-NRGs. (D) The 50 most highly enriched heterodimers, cRPGs versus HE-NRGs. (E) Heterodimers, cRPGs versus all NRGs. (F) The 50 most highly enriched heterodimers, cRPGs versus all NRGs. (G) Heterotrimers, cRPGs versus HE-NRGs. (H) The 50 most highly enriched heterotrimers, cRPGs versus HE-NRGs. (I) Heterotrimers, cRPGs versus all NRGs. (J) The 50 most highly enriched heterotrimers, cRPGs versus all NRGs.
Figure 7.
Figure 7.
Accurate prediction of transcript levels by Least Angle Regression (29) models (see Materials and Methods) requires binding sites of no less than 20 TRs in human and mouse cell types. Cross-validation prediction accuracy is shown in the function of the number of TRs selected by Least Angle Regression.
Figure 8.
Figure 8.
No master regulator emerges from the moderate correlations between TR binding sites and transcript levels in cRPGs. Transcript levels for human K562 and GM12878 cells were taken as the average transcript levels from the Genevestigator Database (30); for mouse MEL and CH12.LX cells RNA sequencing transcript levels were calculated from raw data of the mouse ENCODE Project (31).

Similar articles

Cited by

References

    1. Montgomery S.B., Dermitzakis E.T. From expression QTLs to personalized transcriptomics. Nat. Rev. Genet. 2011;12:277–282. - PubMed
    1. Pickrell J.K. Joint analysis of functional genomic data and genome-wide association studies of 18 human traits. Am. J. Hum. Genet. 2014;94:559–573. - PMC - PubMed
    1. Stephens Z.D., Lee S.Y., Faghri F., Campbell R.H., Zhai C., Efron M.J., Iyer R., Schatz M.C., Sinha S., Robinson G.E. Big Data: Astronomical or Genomical? PLoS Biol. 2015;13:e1002195. - PMC - PubMed
    1. Cookson W., Liang L., Abecasis G., Moffatt M., Lathrop M. Mapping complex disease traits with global gene expression. Nat. Rev. Genet. 2009;10:184–194. - PMC - PubMed
    1. ENCODE Project Consortium. Dunham I., Kundaje A., Aldred S.F., Collins P.J., Davis C.A., Doyle F., Epstein C.B., Frietze S., Harrow J., et al. An integrated encyclopedia of DNA elements in the human genome. Nature. 2012;489:57–74. - PMC - PubMed

Publication types