Impaired Glucose and Insulin Homeostasis in Moderate-Severe CKD
- PMID: 26823551
- PMCID: PMC5004653
- DOI: 10.1681/ASN.2015070756
Impaired Glucose and Insulin Homeostasis in Moderate-Severe CKD
Abstract
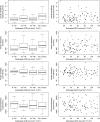
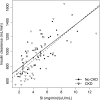
Kidney disease leads to clinically relevant disturbances in glucose and insulin homeostasis, but the pathophysiology in moderate-severe CKD remains incompletely defined. In a cross-sectional study of 59 participants with nondiabetic CKD (mean eGFR =37.6 ml/min per 1.73 m(2)) and 39 healthy control subjects, we quantified insulin sensitivity, clearance, and secretion and glucose tolerance using hyperinsulinemic-euglycemic clamp and intravenous and oral glucose tolerance tests. Participants with CKD had lower insulin sensitivity than participants without CKD (mean[SD] 3.9[2.0] versus 5.0 [2.0] mg/min per µU/ml; P<0.01). Insulin clearance correlated with insulin sensitivity (r=0.72; P<0.001) and was also lower in participants with CKD than controls (876 [226] versus 998 [212] ml/min; P<0.01). Adjustment for physical activity, diet, fat mass, and fatfree mass in addition to demographics and smoking partially attenuated associations of CKD with insulin sensitivity (adjusted difference, -0.7; 95% confidence interval, -1.4 to 0.0 mg/min per µU/ml) and insulin clearance (adjusted difference, -85; 95% confidence interval, -160 to -10 ml/min). Among participants with CKD, eGFR did not significantly correlate with insulin sensitivity or clearance. Insulin secretion and glucose tolerance did not differ significantly between groups, but 65% of participants with CKD had impaired glucose tolerance. In conclusion, moderate-severe CKD associated with reductions in insulin sensitivity and clearance that are explained, in part, by differences in lifestyle and body composition. We did not observe a CKD-specific deficit in insulin secretion, but the combination of insulin resistance and inadequate augmentation of insulin secretion led to a high prevalence of impaired glucose tolerance.
Keywords: chronic kidney disease; insulin resistance; metabolism; obesity; renal insulin resistance.
Copyright © 2016 by the American Society of Nephrology.
Figures


References
-
- Hutchings R, Hegstrom R, Scribner BH: Glucose intolerance in patients on long-term intermittent dialysis. Ann Intern Med 65: 275–285, 1966
-
- Siew ED, Ikizler TA: Determinants of insulin resistance and its effects on protein metabolism in patients with advanced chronic kidney disease. Contrib Nephrol 161: 138–144, 2008 - PubMed
-
- Zubrod CG, Eversole SL, Dana GW: Amelioration of diabetes and striking rarity of acidosis in patients with Kimmelstiel-Wilson lesions. N Engl J Med 245: 518–528, 1951 - PubMed
Publication types
MeSH terms
Substances
Grants and funding
LinkOut - more resources
Full Text Sources
Other Literature Sources
Medical
Research Materials
Miscellaneous

