. 2016 Jan 8;2(1):e1501292.
doi: 10.1126/sciadv.1501292. eCollection 2016 Jan.

Targeting NF-κB in glioblastoma: A therapeutic approach

Affiliations

Targeting NF-κB in glioblastoma: A therapeutic approach

Dinorah Friedmann-Morvinski et al. Sci Adv. .

Abstract

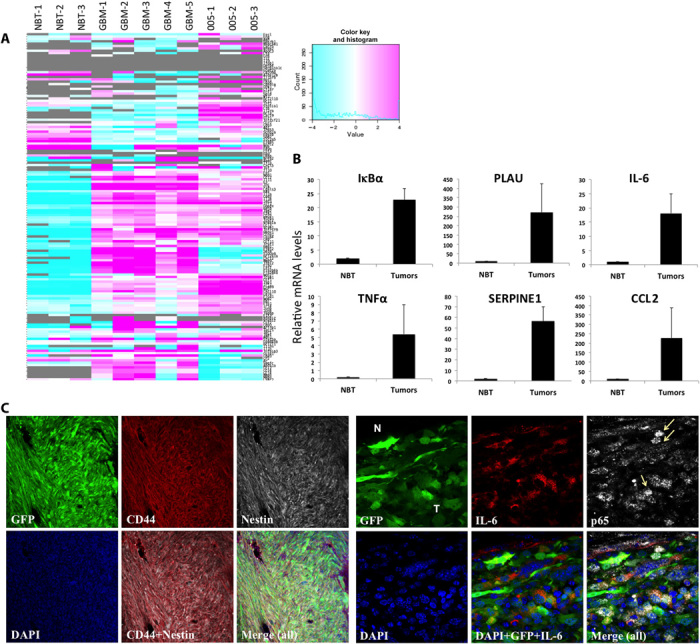
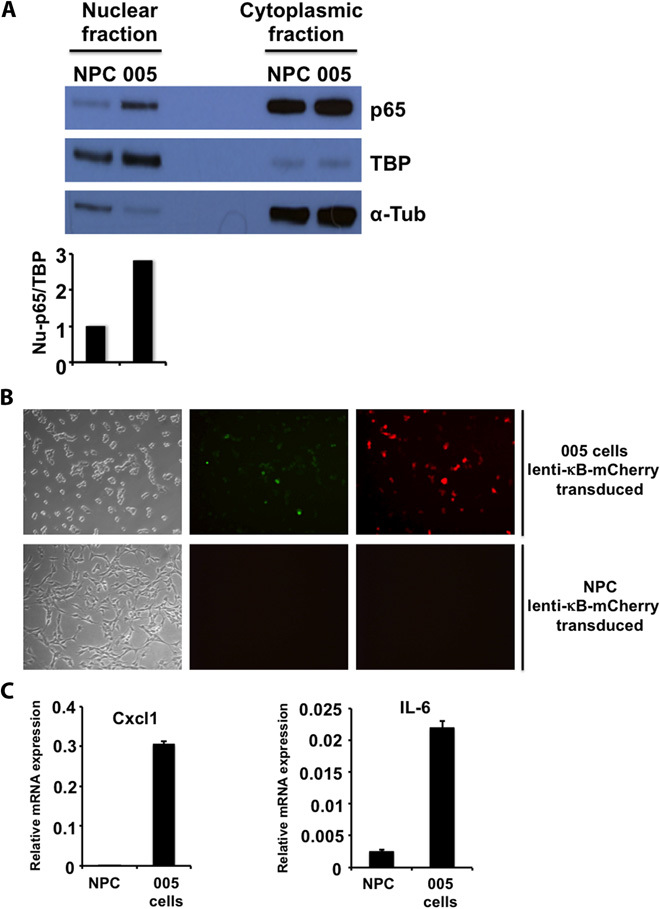
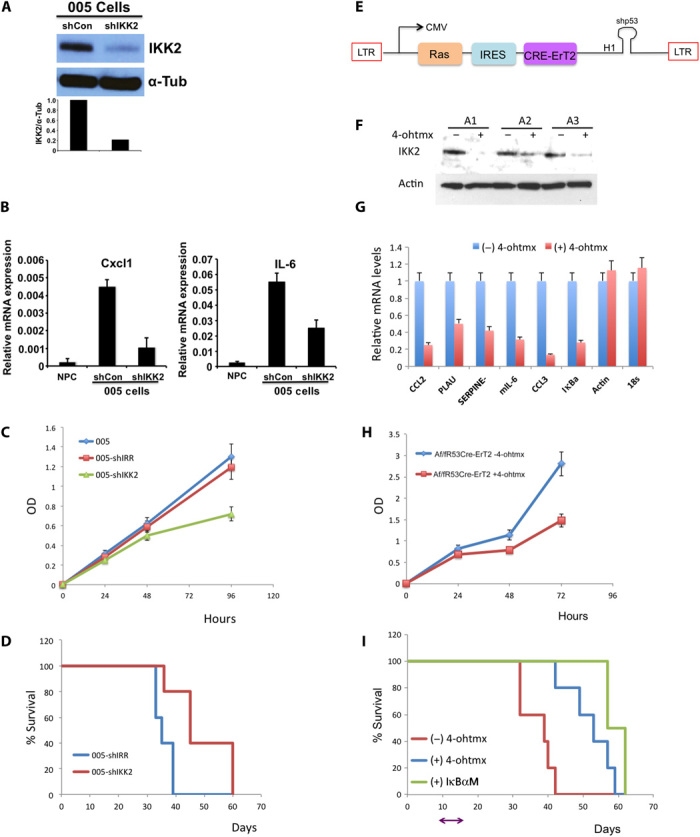
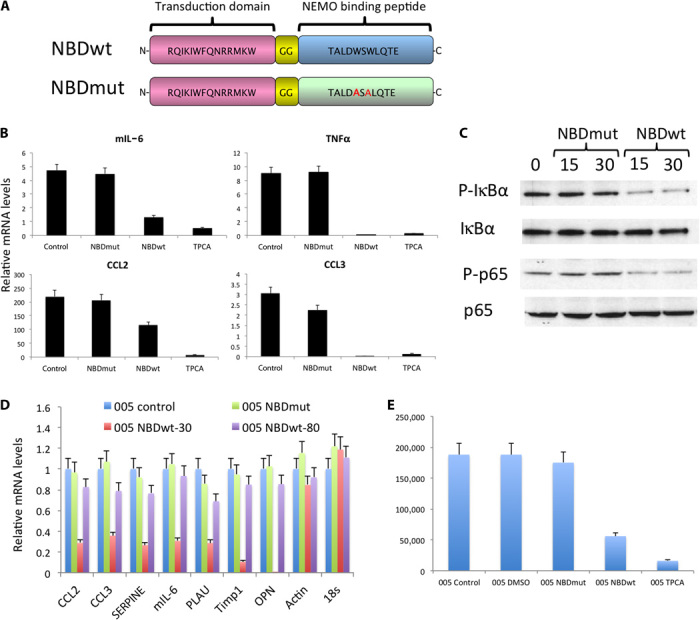
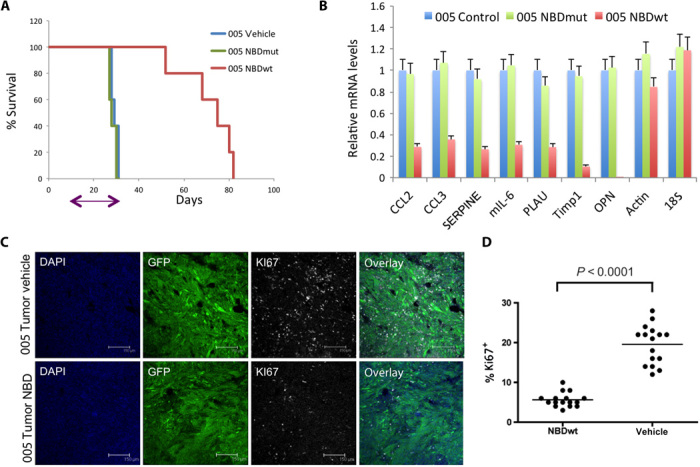
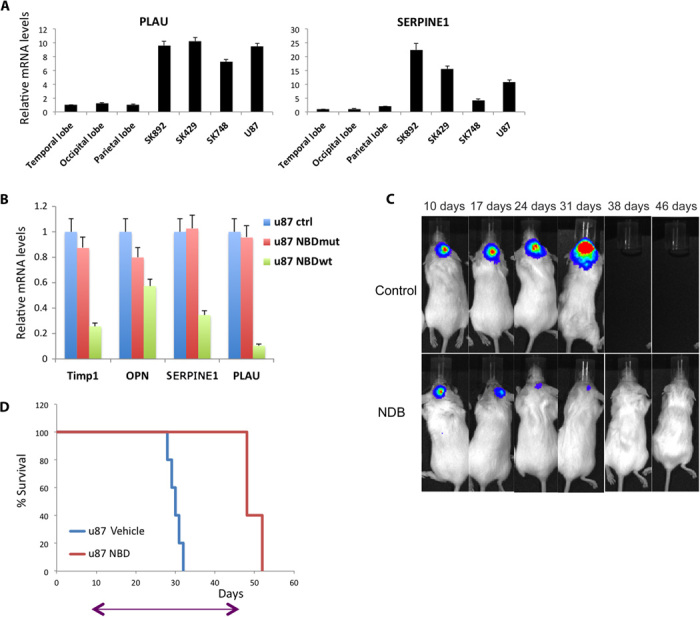
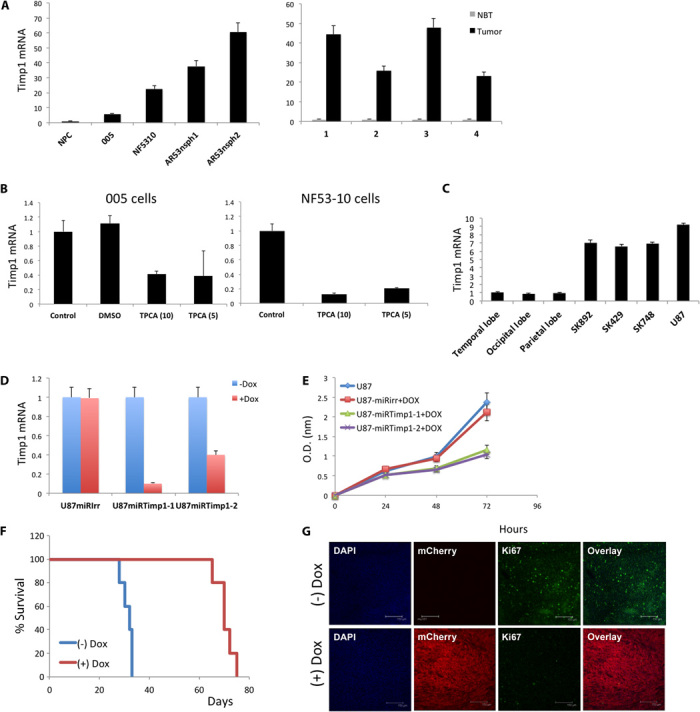
Glioblastoma multiforme (GBM) is the most common and lethal form of intracranial tumor. We have established a lentivirus-induced mouse model of malignant gliomas, which faithfully captures the pathophysiology and molecular signature of mesenchymal human GBM. RNA-Seq analysis of these tumors revealed high nuclear factor κB (NF-κB) activation showing enrichment of known NF-κB target genes. Inhibition of NF-κB by either depletion of IκB kinase 2 (IKK2), expression of a IκBαM super repressor, or using a NEMO (NF-κB essential modifier)-binding domain (NBD) peptide in tumor-derived cell lines attenuated tumor proliferation and prolonged mouse survival. Timp1, one of the NF-κB target genes significantly up-regulated in GBM, was identified to play a role in tumor proliferation and growth. Inhibition of NF-κB activity or silencing of Timp1 resulted in slower tumor growth in both mouse and human GBM models. Our results suggest that inhibition of NF-κB activity or targeting of inducible NF-κB genes is an attractive therapeutic approach for GBM.

Keywords: Gliomas; NF-κB inhibitors; TIMP1; Xenografts.


Figures

Fig. 1
Fig. 1. Constitutive NF-κB activation in the lentivirus-induced GBM mouse model.
(A) Heat map of the RNA-Seq analysis of NF-κB target genes (list of 150 genes; http://bioinfo.lifl.fr/NF-KB/) comparing normal brain tissue (NBT; n = 3), HRas-shp53–induced GBM tumors (n = 5), and 005 tumors (n = 3). (B) qRT-PCR analysis of six representative NF-κB target genes in NBT and tumor samples. (C) Immunofluorescence staining of CD44 (red) and Nestin (white) in tumor sections shows MES subtype (left) and nuclear p65 (white) staining, and IL-6 (red) confirms NF-κB activation in these tumors (right). Arrows point to p65 staining in the nucleus of cells. N, normal tissue; T, tumor; PLAU, plasminogen activator, urokinase; SERPINE1, serpin peptidase inhibitor, clade E (nexin, plasminogen activator inhibitor type 1), member 1; CCL2, chemokine (C-C motif) ligand 2; DAPI, 4′,6-diamidino-2-phenylindole.
Fig. 2
Fig. 2. NF-κB activation in BTICs.
(A) Western blot analysis of nuclear and cytoplasmic fractions of 005 BTICs and control NPCs for p65 and for loading control TATA binding protein (TBP; nuclear protein) and α-tubulin (α-Tub; cytoplasmic protein). (B) Bright and immunofluorescence imaging of 005 BTICs and NPCs transduced with a lenti-κB-mCherry reporter virus. Transduced cells were selected for puromycin resistance. Green, green fluorescent protein (GFP); red, mCherry. (C) qRT-PCR analysis of two representative NF-κB target genes in 005 BTICs and control NPCs. Cxcl1, chemokine (C-X-C motif) ligand 1.
Fig. 3
Fig. 3. IKK2 depletion affects the proliferative capacity of tumor cells and prolongs mice survival.
(A) Western blot analysis of the silencing of IKK2 in 005 BTICs. 005 cells were transduced with either a scrambled shRNA control (shCon) or an shRNA targeting IKK2 (shIKK2). α-Tubulin (α-Tub) was used as loading control. (B) Silencing of IKK2 was further validated by decreased relative mRNA levels of representative NF-κB target genes (qRT-PCR analysis). Actin and 18S were used as control genes not affected by silencing of IKK2. (C) 005 control, 005-shIRR (transduced with scrambled shRNA), and 005-shIKK2 were seeded on culture plates (in triplicate), and WST-1 cell proliferation assay reagent was used to monitor cell proliferation at the indicated time points. (D) Kaplan-Meier curves show the survival of mice implanted with 005-shIRR or 005-shIKK2 at 3 × 10⁵ cells per mouse. (E) Diagram of lentivector design: the GFP cassette in the HRas-shp53 vector was replaced by Cre-ErT2. (F) Induced silencing of IKK2 in primary cortical astrocytes from IKK2fl/fl transgenic mice. Astrocytes from three IKK2fl/fl mice were isolated (A1, A2, and A3) and transduced with HRas-shp53-Cre-ErT2. Western blot analysis confirmed IKK2 deletion by addition of 4-ohtmx to the culture media. (G) Deletion of IKK2 by addition of 4-ohtmx was further validated by qRT-PCR of representative NF-κB target genes. (H) Af/fR53Cre-ErT2 cells were seeded on culture plates (in triplicate) in the absence or presence of 4-ohtmx, and WST-1 cell proliferation assay reagent was used to monitor cell proliferation at the indicated time points. (I) Kaplan-Meier curve shows the survival of mice implanted with Af/fR53Cre-ErT2 or Af/fR53Cre-ErT2 transduced with lenti-IκBαM (Af/fR53Cre-ErT2-IκBαM) at 3 × 10⁵ cells per mouse. On day 10 after transplantation, one group of Af/fR53Cre-ErT2–implanted mice received 4-ohtmx for 5 days to delete IKK2. OD, optical density; LTR, long terminal repeat; CMV, cytomegalovirus; IRES, internal ribosomal entry site; CCL3, chemokine (C-C motif) ligand 3.
Fig. 4
Fig. 4. Effects of the NBD peptide on mouse glioma cell lines.
(A) Diagram of the NBDwt and NBDmut peptides. The W amino acids in the NBDwt peptide were substituted by A in the NBDmut (highlighted in red). (B) qRT-PCR analysis of NF-κB representative genes. Af/fR53Cre-ErT2 cells were incubated with NBDmut (50 μM), NBDwt (50 μM), or TPCA inhibitor (5 μM) for 24 hours. (C) Af/fR53Cre-ErT2 cells were incubated with either NBDmut or NBDwt at a concentration of 50 μM for the indicated times. Cell lysates were analyzed by Western blot analysis. (D) qRT-PCR analysis of NF-κB representative genes. 005 BTICs were incubated with either NBDmut or NBDwt at a concentration of 50 μM for 24 hours. (E) 005 cells were incubated with either NBDmut or NBDwt at a concentration of 50 μM or with TPCA inhibitor (5 μM) for 48 hours. Cell numbers (viable cells) were counted.
Fig. 5
Fig. 5. Treatment of 005 tumors with the NBD peptide attenuated tumor growth.
(A) Kaplan-Meier curve shows the survival of mice implanted with 005 cells at 3 ×10⁵ cells per mouse. On day 10 after transplantation, mice received a daily dose of either NBDmut or NBDwt (10 mg/kg) intraperitoneally for 20 days (n = 10); arrow indicates length of treatment (P = 0.01). (B) RNA was isolated from GFP+ tumors of two representative mice from the NBDwt-treated group sacrificed on day 30 (NBDwt-30; small lesion), together with two mice from the NBDwt (NBDwt-80), NBDmut, and control groups all at end point. qRT-PCR analysis shows decreased mRNA levels of representative NF-κB genes in NBDwt-treated mice. (C) Tumors from NBDwt and vehicle-treated mice (end point) were collected, and sections were immunostained with Ki67 and analyzed by confocal microscopy. (D) Quantification of Ki67+ cells at multiple fields.
Fig. 6
Fig. 6. Treatment of human GBM with the NBD peptide prolongs mice survival.
(A) qRT-PCR analysis of PLAU and SERPINE1 in human-derived glioma cell lines and normal brain tissue from the indicated regions. Error bar indicates ±SD. (B) qRT-PCR analysis of NF-κB target genes after treatment with either NBDmut or NBDwt for 24 hours. Error bar indicates ±SD. (C) Mice were monitored by IVIS imaging at the indicated time points; one representative mouse from each of the indicated groups is shown. (D) Kaplan-Meier curve shows the survival of mice implanted with U87 cells at 3 × 10⁵ cells per mouse. On day 10 after transplantation, mice received a daily dose of NBDwt (10 mg/kg) intraperitoneally for 36 days (n = 10); arrow indicates length of treatment.
Fig. 7
Fig. 7. Timp1 expression in mouse and human glioma cells.
(A) qRT-PCR analysis of Timp1 in mouse glioma cell lines and NPCs as control (left graph) and four different tumors induced by injection of HRas-shp53 and the corresponding normal brain tissue (control; right graph). Error bar indicates ±SD. (B) qRT-PCR analysis of Timp1 after treatment with the TPCA inhibitor in 005 and NF5310 cells for 24 hours. Error bar indicates ±SD. (C) qRT-PCR analysis of Timp1 in human-derived glioma cell lines and normal brain tissue from the indicated regions. Error bar indicates ±SD. (D) qRT-PCR analysis of Timp1 after knockdown of Timp1 with an inducible shTimp1 vector (miRTimp1-1 and miRTimp1-2; a scrambled miRIrr was used as control) in U87 cells. Timp1 knockdown was induced by adding Dox to the culture media. Error bar indicates ±SD. (E) U87 cells transduced with either miRIrr, miRTimp1-1, or miRTimp1-2 were seeded on culture plates (in triplicate), and WST-1 cell proliferation assay reagent was used to monitor cell proliferation at the indicated time points. Timp1 knockdown was induced by Dox. Error bar indicates ±SD. (F) Kaplan-Meier plot of survival for mice fed normal chow [miRTimp1(−)Dox; n = 10] and Dox-containing chow [miRTimp1(+)Dox; n = 10]. The (+)Dox group was fed the special chow 10 days after the transplantation of U87-miRTimp1 cells [3 × 10⁵ cells per mouse; arrow indicates the beginning of (+)Dox chow diet]. (G) Tumors from each group were collected at the end of the experiment, and brain sections (40 nm) were immunostained with Ki67 and analyzed using confocal microscopy. mCherry is a fluorescent reporter expressed in the lentiviral microRNA construct. DAPI nuclei. Scale bar, 150 μm. DMSO, dimethyl sulfoxide.

Similar articles

Cited by

References

    1. Furnari F. B., Fenton T., Bachoo R. M., Mukasa A., Stommel J. M., Stegh A., Hahn W. C., Ligon K. L., Louis D. N., Brennan C., Chin L., DePinho R. A., Cavenee W. K., Malignant astrocytic glioma: Genetics, biology, and paths to treatment. Genes Dev. 21, 2683–2710 (2007). - PubMed
    1. Huse J. T., Holland E. C., Targeting brain cancer: Advances in the molecular pathology of malignant glioma and medulloblastoma. Nat. Rev. Cancer 10, 319–331 (2010). - PubMed
    1. Stiles C. D., Rowitch D. H., Glioma stem cells: A midterm exam. Neuron 58, 832–846 (2008). - PubMed
    1. Cooper L. A. D., Kong J., Gutman D. A., Wang F., Cholleti S. R., Pan T. C., Widener P. M., Sharma A., Mikkelsen T., Flanders A. E., Rubin D. L., Van Meir E. G., Kurc T. M., Moreno C. S., Brat D. J., Saltz J. H., An integrative approach for in silico glioma research. IEEE Trans. Biomed. Eng. 57, 2617–2621 (2010). - PMC - PubMed
    1. Huse J. T., Phillips H. S., Brennan C. W., Molecular subclassification of diffuse gliomas: Seeing order in the chaos. Glia 59, 1190–1199 (2011). - PubMed

Publication types