. 2016 Feb 24;138(7):2352-65.
doi: 10.1021/jacs.5b13273. Epub 2016 Feb 15.

Tracking Sodium-Antimonide Phase Transformations in Sodium-Ion Anodes: Insights from Operando Pair Distribution Function Analysis and Solid-State NMR Spectroscopy

Affiliations

Tracking Sodium-Antimonide Phase Transformations in Sodium-Ion Anodes: Insights from Operando Pair Distribution Function Analysis and Solid-State NMR Spectroscopy

Phoebe K Allan et al. J Am Chem Soc. .

Abstract

Operando pair distribution function (PDF) analysis and ex situ (23)Na magic-angle spinning solid-state nuclear magnetic resonance (MAS ssNMR) spectroscopy are used to gain insight into the alloying mechanism of high-capacity antimony anodes for sodium-ion batteries. Subtraction of the PDF of crystalline NaxSb phases from the total PDF, an approach constrained by chemical phase information gained from (23)Na ssNMR in reference to relevant model compounds, identifies two previously uncharacterized intermediate species formed electrochemically; a-Na(3-x)Sb (x ≈ 0.4-0.5), a structure locally similar to crystalline Na3Sb (c-Na3Sb) but with significant numbers of sodium vacancies and a limited correlation length, and a-Na(1.7)Sb, a highly amorphous structure featuring some Sb-Sb bonding. The first sodiation breaks down the crystalline antimony to form first a-Na(3-x)Sb and, finally, crystalline Na3Sb. Desodiation results in the formation of an electrode formed of a composite of crystalline and amorphous antimony networks. We link the different reactivity of these networks to a series of sequential sodiation reactions manifesting as a cascade of processes observed in the electrochemical profile of subsequent cycles. The amorphous network reacts at higher voltages reforming a-Na(1.7)Sb, then a-Na(3-x)Sb, whereas lower potentials are required for the sodiation of crystalline antimony, which reacts to form a-Na(3-x)Sb without the formation of a-Na(1.7)Sb. a-Na(3-x)Sb is converted to crystalline Na3Sb at the end of the second discharge. We find no evidence of formation of NaSb. Variable temperature (23)Na NMR experiments reveal significant sodium mobility within c-Na3Sb; this is a possible contributing factor to the excellent rate performance of Sb anodes.


Conflict of interest statement

The authors declare no competing financial interest.

Figures

Figure 1
Figure 1
(a) Left: unit cell of Na3Sb (top) and 1 × 2 × 1 unit cells of NaSb showing the helical chains of antimony (bottom). Antimony is shown in blue. For Na3Sb, Na1 is shown in green and Na2 in orange. For NaSb, the sodium is shown in orange. (b) Middle: 23Na NMR spectra of synthesized Na3Sb at 268 K (top), Na3Sb at 298 K (middle) and NaSb (bottom), all recorded at 10 kHz MAS with an external field of 16.4 T. Chemical shifts of major isotropic resonances are marked. * = spinning sidebands. (c) Right: least-squared refinement of Na3Sb (top) and NaSb (bottom) structures against ex situ PDF data. Experimental data is shown as symbols, green lines shows the calculated PDF. The difference between the experimental and model PDFs is shown by the black line, offset for clarity. A 7% Sb impurity (by mass) is present in the NaSb sample.
Figure 2
Figure 2
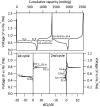
Top: (De)sodiation curves obtained for antimony vs sodium metal cycled at a rate of C/20 in the voltage range of 2.5 to 0 V. The different electrochemical processes are labeled and these labels referred to subsequently in the text. Bottom: dQ/dV plots for 1st and 2nd cycle. The different electrochemical processes are marked with a notation that is used throughout the subsequent text.
Figure 3
Figure 3
(a) Ex situ 23Na NMR spectra (normalized) of cycled Sb electrodes at the states of charge. Spectra were recorded at 10 kHz MAS with an external field of 16.4 T. Chemical shifts of major isotropic resonances are marked. The shaded region marks where resonances from sodium within the CMC binder, the SEI and the conductive carbon are dominant. * mark spinning sidebands. Number (#) of sodiums per antimony is labeled next to each spectra, based on the calculations outlined in the Supporting Information, EOS = end of sodiation, EOD = end of desodiation. Alternate lines are dashed for clarity. (b) Discharge–charge curves obtained for Sb during the in situ PDF measurements. (c) Selected PDFs obtained during the first discharge, first charge and second discharge cycles by Fourier transforming the total scattering X-ray data. PDF are vertically offset in time. The colors of the curves correspond to the colors of the points on the electrochemical curve in (b) where the samples were extracted for NMR/PDF analyses.
Figure 4
Figure 4
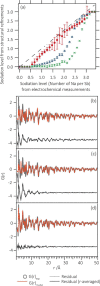
(a) Comparison of the sodiation calculated from electrochemical measurements and from the phase fractions determined from least-squares refinements of PDF data. The dashed line shows the expected sodiation from electrochemical measurements. Blue triangles show the sodiation calculated from a two-phase fit using c-Sb and c-Na3Sb in the distance range (20–50 Å); green crosses show the sodiation calculated from a two-phase fit using c-Sb and c-Na3Sb in the distance range (2–50 Å); red circles show the sodiation calculated from a three-phase refinement using c-Sb, c-Na3Sb and a-Na3–xSb. Details of calculations are shown in section 2.3. Bottom: Real-space least-squares refinements against PDF data at an electrode stoichiometry of Na2.36Sb during the first sodiation. (b) A two phase refinement in the range 2–50 Å. (c) A constrained refinement where the values obtained during a refinement in the distance range 20–50 Å were fixed for the refinement in the full distance range. (d) Three phase refinement using c-Sb, c-Na3Sb and a-Na3–xSb (x = 0.5). For all refinements, experimental data is shown in gray circles, the fit to the data in orange, and the residual in gray (raw) or black (r-averaged over termination ripples). This residual is shown offset for clarity. Details of the calculations used to estimate error bars on the sodiation levels are shown in the Supporting Information.
Figure 5
Figure 5
PDFs for the a-Na3–xSb intermediate formed during S1-a as a function of sodiation. Phase fractions for the crystalline phases are obtained from a two phase (c-Sb and c-Na3Sb) refinements against data at high-r (20–50 Å). These phase fractions were then fixed for refinements against data over the full r-range. The residual of these refinements represents the additional amorphous phases present in the electrode. The positions of the major peaks are marked. The electrochemical profile of the first sodiation is shown below; the color of the curve corresponds to the point on the electrochemical curve designated by the dot of that color.
Figure 6
Figure 6
(a) PDFs for the amorphous phases formed during (de)sodiation of antimony extracted from experimental data: a-Na1.0Sb extracted from the amorphous component of the PDF at the end of D1-b; a-Na1.7Sb extracted from the amorphous component of the PDF at the end of D1-a; a-Na3–xSb is the PDF extracted from the end of S2-c. Distinguishing distances for each of the phases are marked on the PDFs and calculated PDFs for c-Sb and c-Na3Sb (scaled by 0.5) are shown for comparison. (b) An Sb–Sb offset dumbbell arrangement giving rise to peaks in the same positions as the PDF for a-Na1.7Sb. (c) Comparison the arrangement of Sb in c-Na3Sb (left) and c-Sb (right) looking down the c-axis; sodium is shown in orange, antimony is in blue. Light blue atoms lie in one plane, dark blue lie offset in another plane.
Figure 7
Figure 7
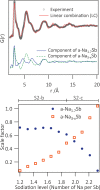
Results of linear combination fitting of the PDFs extracted during processes S2-b and S2-c with PDFs for a-Na1.7Sb (obtained from D1-a) and a-Na3–xSb (from the end of D2-c). Top: Example of the fit of the linear combination (orange line) with experimental data (gray circles). The difference between the experimental data and the fit is shown offset in gray. The contribution of a-Na1.7Sb (blue solid line) and a-Na3–xSb (green dashed line) is shown offset below. Bottom: Variation of the scale factors for a-Na1.7Sb (blue circles) and a-Na3–xSb (orange squares) with sodiation level.
Figure 8
Figure 8
PDF and NMR-derived mechanism of (de)sodiation of antimony from the first desodiation during galvanostatic cycling at a rate of C/20.

References

    1. Dahbi M.; Yabuuchi N.; Kubota K.; Tokiwa K.; Komaba S. Phys. Chem. Chem. Phys. 2014, 16, 15007.10.1039/c4cp00826j. - DOI - PubMed
    1. Komaba S.; Matsuura Y.; Ishikawa I.; Yabuuchi N.; Murata W.; Kuze S. Electrochem. Commun. 2012, 21, 65.10.1016/j.elecom.2012.05.017. - DOI
    1. Darwiche A.; Marino C.; Sougrati M. T.; Fraisse B.; Stievano L.; Monconduit L. J. Am. Chem. Soc. 2012, 134, 20805.10.1021/ja310347x. - DOI - PubMed
    1. Baggetto L.; Keum J. K.; Browning J. F.; Veith G. M. Electrochem. Commun. 2013, 34, 41.10.1016/j.elecom.2013.05.025. - DOI
    1. Baggetto L.; Ganesh P.; Sun C.-N.; Meisner R. A.; Zawodzinski T. A.; Veith G. M. J. Mater. Chem. A 2013, 1, 7985.10.1039/c3ta11568b. - DOI

Publication types

LinkOut - more resources