. 2016 Jan 29;11(1):e0147777.
doi: 10.1371/journal.pone.0147777. eCollection 2016.

Determination of B-Cell Epitopes in Patients with Celiac Disease: Peptide Microarrays

Affiliations

Determination of B-Cell Epitopes in Patients with Celiac Disease: Peptide Microarrays

Rok Seon Choung et al. PLoS One. .

Abstract

Background: Most antibodies recognize conformational or discontinuous epitopes that have a specific 3-dimensional shape; however, determination of discontinuous B-cell epitopes is a major challenge in bioscience. Moreover, the current methods for identifying peptide epitopes often involve laborious, high-cost peptide screening programs. Here, we present a novel microarray method for identifying discontinuous B-cell epitopes in celiac disease (CD) by using a silicon-based peptide array and computational methods.

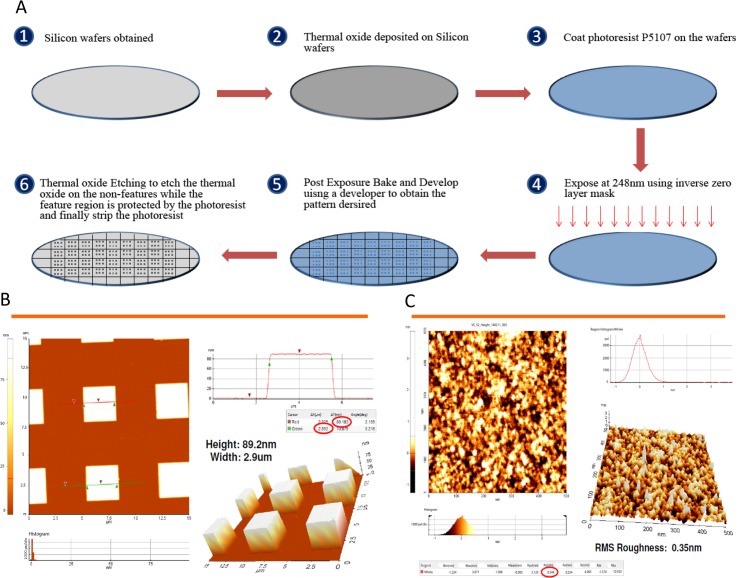
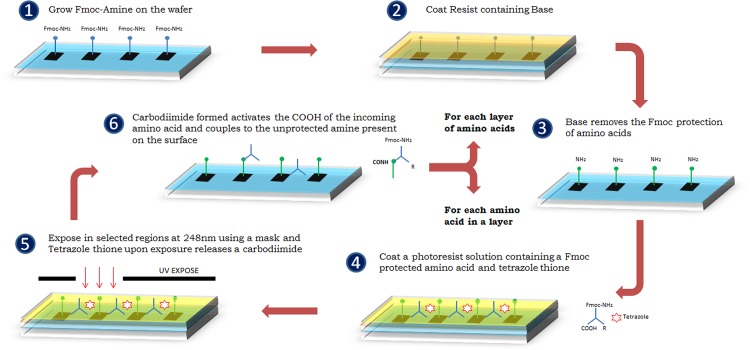
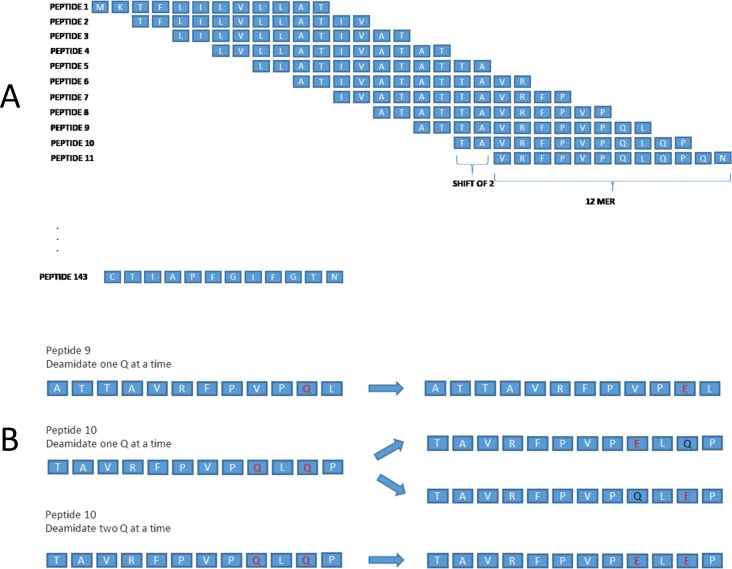
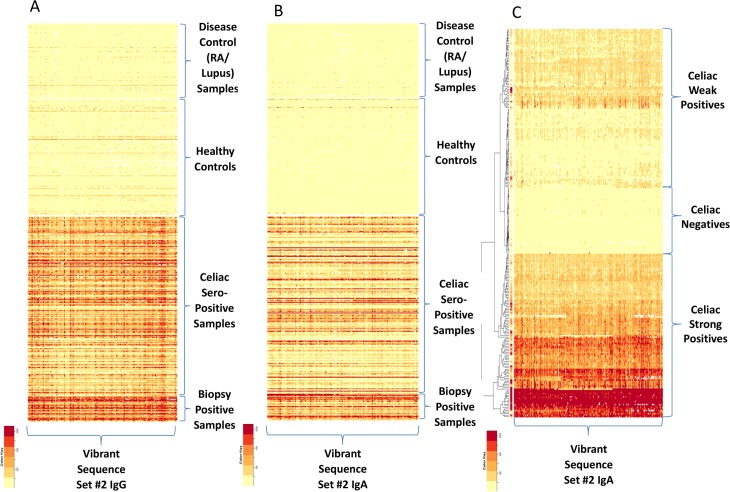
Methods: Using a novel silicon-based microarray platform with a multi-pillar chip, overlapping 12-mer peptide sequences of all native and deamidated gliadins, which are known to trigger CD, were synthesized in situ and used to identify peptide epitopes.

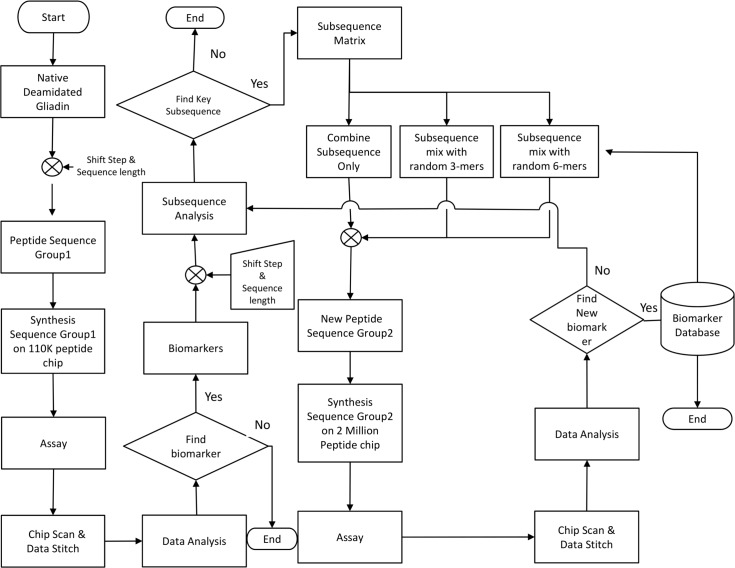
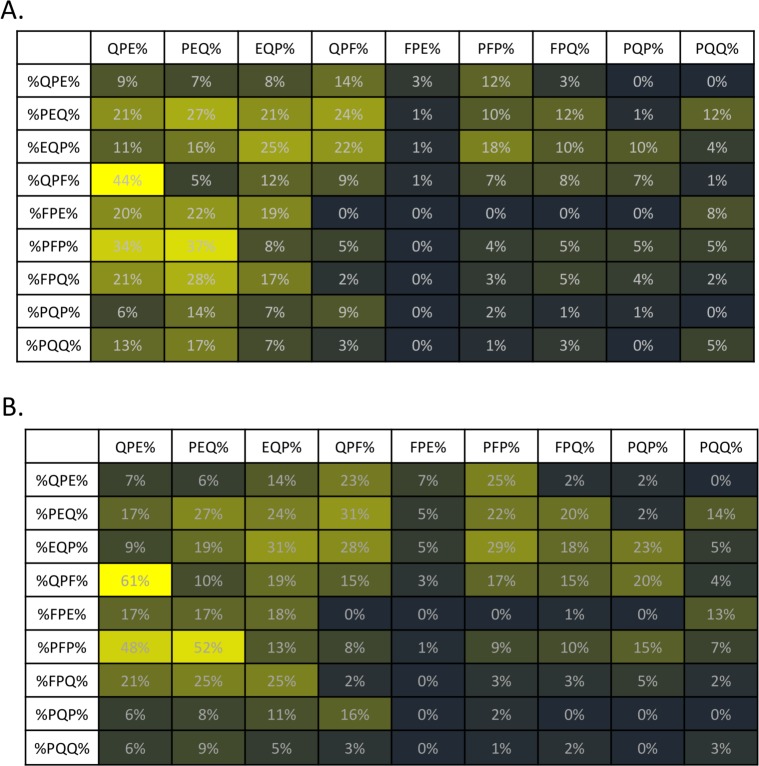
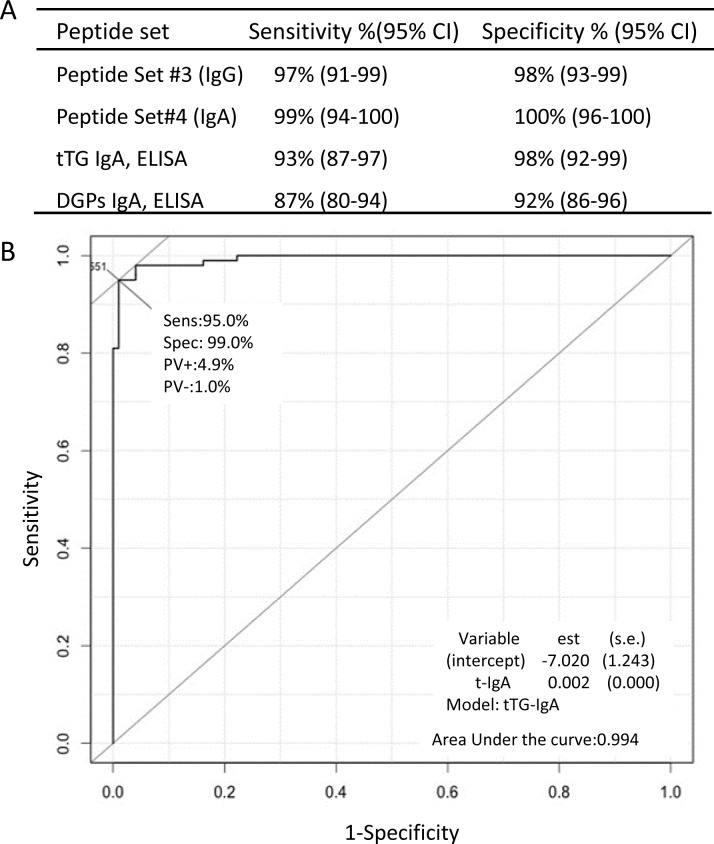
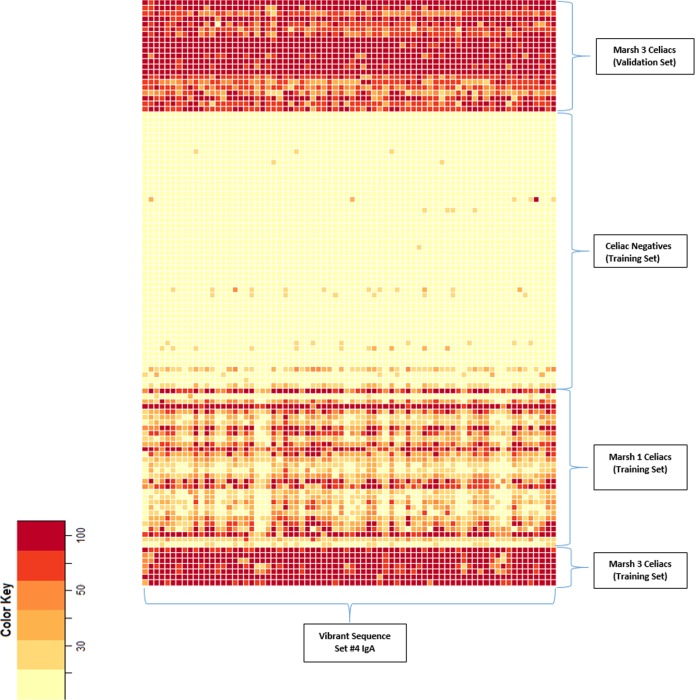
Results: Using a computational algorithm that considered disease specificity of peptide sequences, 2 distinct epitope sets were identified. Further, by combining the most discriminative 3-mer gliadin sequences with randomly interpolated3- or 6-mer peptide sequences, novel discontinuous epitopes were identified and further optimized to maximize disease discrimination. The final discontinuous epitope sets were tested in a confirmatory cohort of CD patients and controls, yielding 99% sensitivity and 100% specificity.

Conclusions: These novel sets of epitopes derived from gliadin have a high degree of accuracy in differentiating CD from controls, compared with standard serologic tests. The method of ultra-high-density peptide microarray described here would be broadly useful to develop high-fidelity diagnostic tests and explore pathogenesis.


Conflict of interest statement

Competing Interests: The authors have the following interests. John Rajasekaran, Vasanth Jayaraman, Kang Bei, Hari Krishnamurthy, Tianhao Wang and Karthik Krishna are employed by Vibrant Sciences. Dr Pasricha's participation in this publication was as a paid consultant for Vibrant Sciences. All opinions expressed and implied in this publication are solely those of Dr Pasricha and do not represent or reflect the views of the Johns Hopkins University or the Johns Hopkins Health System. Material related to the subject matter discussed in the present article has previously been disclosed in the International Patent Application Nos. PCT/US2013/070207 and PCT/US2013/025190. This does not alter the authors’ adherence to all the PLOS ONE policies on sharing data and materials, as detailed online in the guide for authors.

Figures

Fig 1
Fig 1. Silicon Wafer Processing.
A) Silicon Wafer Substrate Preparation. 1) After silicon wafers obtained, 2) thermal oxide deposited on Silicon wafers. 3) Then, the wafer was uniformly coated with P5107 (photoresist, Rohm and Haas Chemicals), using a RF3S coater (Sokudo). 4) The wafer was exposed to 248nm wavelength ultraviolet light with an inverse zero layer mask. 5) This was followed by post-exposure baking and developing. 6) Finally, after wet oxide etching on the non-features, stripping the photoresist of wafers was done. B) Completed pillar substrate. The size of the square completed pillars is about 3 μm × 3 μm in width and 89 nm in height. C) Root Mean Square (RMS) roughness in a pillar. Atomic force microscopy was used to estimate the roughness of the surface. RMS roughness in a pillar was 0.35nm.
Fig 2
Fig 2. The process for 1-step amine side peptide synthesis.
is added 1) Fluorenylmethyloxycarbonyl (Fmoc) amino acids were assembled on the silicon wafer. 2) A base resist solution was coated on the wafer. 3) Fmoc protection was removed in all features, leaving the unprotected amine group. 4) The incoming amino acid activation solution cocktail (includes Fmoc amino acids and tetrazole thione) was added and coated onto a wafer. 5) Then the wafer is exposed to 248 nm wavelength ultraviolet lights using a reticle. On exposure, tetrazole thione releases a carbodiimide. 6) Lastly, the Fmoc amino acid is activated and coupled to the unprotected amine present on the wafer, completing the coupling of 1 layer of amino acid.
Fig 3
Fig 3. Examples of synthesized overlapping 12-mer peptide sequences of alpha gliadin.
A) Examples of overlapping 12 amino acids long peptides with a lateral shift of 2 amino acids covering the alpha gliadin sequence are shown. B) Examples of modification (substitution of glutamic acid for glutamine) of native gliadin sequences 1 at a time and 2 at a time.
Fig 4
Fig 4. Flowchart for Biomarker Selection.
Overlapping 12-mer peptide sequences of α, β, γ, or Ω fractions of gliadin and modified gliadin peptides sequences (substitution of glutamic acid for glutamine, MGPs), were synthesized on a 110,000 array. Deamidation is performed by replacing certain glutamine (Q) present in the sequence with glutamic acid (E). These synthesized peptides sequences were tested for antibody binding to celiac positive samples. After obtaining data of binding intensity from the immunoassay, the most frequently occurring key subsequences were identified. Based on these key subsequences, a new peptide subsequences, which is the combination of key 3-mer subsequences and random 3-and 6-mer subsequences, was formed to in silico form. (Random sequences were generated using a simple random generator program in MATLAB.) These newly assembled sequences were then synthesized on a peptide array to perform the immunoassay with celiac positive samples for identifying the new biomarkers to distinguish CD from controls.
Fig 5
Fig 5. Celiac Subsequence Matrix.
The 3-mer subsequences with maximum occurrences among sequences with high sensitivity and specificity for among IgG and IgA reactivity were determined, and the best combinations of subsequences were plotted as a matrix table. The nine 3-mers with the highest score were combined in each possible iteration of two 3-mers to form 81 6-mer sequences, with N-terminal sub-sequences listed in the column, and the C-terminal sub-sequences listed in the row. A) IgG 3-mer subsequences, maximum occurrences. B) IgA 3-mer subsequences, maximum occurrences. % implies any number of amino acid(s) present prior to the subsequence portion of the sequence. For example, ‘%QPE’ could be WALLTYQPE while ‘%QPE%’ could be WAQPELLTY.
Fig 6
Fig 6. Sensitivity and Specificity of the Novel Peptide Sets for CD (A) and ROC Curve (B).
A) Discriminant power of the peptide sets (#3 and #4) of discontinuous B-cell epitopes for the diagnosis of CD, compared to the currently used ELISA kits for the diagnosis of CD (Inova Diagnostics). These kits measure IgA antibodies to tTg and IgA antibodies to DGPs. B) Example of a synthetic DGP with a high area under the curve (0.99). The ROC curve is plotted on the basis of 1-specificity and sensitivity under each threshold for each sequence. CD indicates celiac disease; modified gliadin peptides, which glutamic acid was substituted for glutamine; ELISA, enzyme-linked immunosorbent assay; ROC, receiver operating characteristic; tTg, tissue transglutaminase. The amino acid sequences of peptide set #3 and #4 are shown in S2 Table.
Fig 7
Fig 7. Heat Maps of Antibody-Binding Intensity in Validation Set Samples.
A) Heat-map shows antibody-binding data for a peptide set #3 (IgG) with high significance values to differentiate samples seropositive for celiac disease (CD) from controls and disease controls. B) Heat map shows antibody-binding data for a peptide set #4 of IgA. C) Heat map shows the natural subgrouping of CD weak positives and strong positives and negatives based on a hierarchical clustering algorithm[27] from a peptide analyzer in a confirmatory cohort. RA indicates rheumatoid arthritis.
Fig 8
Fig 8. Heat Map Based on Duodenal Pathology With Marsh Classification.
The heat map shows 2 clusters of high or low antibody-binding intensity of the identified peptide in the set. Thirty-three patients with celiac disease autoimmunity in whom the disease was subsequently diagnosed after blood was drawn in the confirmatory cohort also showed high binding intensity, which was similar to the high-intensity group in the exploratory set.

Similar articles

Cited by

References

    1. Kijanka G, Murphy D. Protein arrays as tools for serum autoantibody marker discovery in cancer. J Proteomics. 2009;72: 936–44. 10.1016/j.jprot.2009.02.006 - DOI - PubMed
    1. Ballew JT, Murray JA, Collin P, Maki M, Kagnoff MF, Kaukinen K, et al. Antibody biomarker discovery through in vitro directed evolution of consensus recognition epitopes. Proc Natl Acad Sci U S A. 2013;110: 19330–5. 10.1073/pnas.1314792110 - DOI - PMC - PubMed
    1. Lewis JD. The utility of biomarkers in the diagnosis and therapy of inflammatory bowel disease. Gastroenterology. 2011;140: 1817–26 e2. 10.1053/j.gastro.2010.11.058 - DOI - PMC - PubMed
    1. Solier C, Langen H. Antibody-based proteomics and biomarker research—current status and limitations. Proteomics. 2014;14: 774–83. 10.1002/pmic.201300334 - DOI - PubMed
    1. Price JV, Tangsombatvisit S, Xu G, Yu J, Levy D, Baechler EC, et al. On silico peptide microarrays for high-resolution mapping of antibody epitopes and diverse protein-protein interactions. Nat Med. 2012;18: 1434–40. - PMC - PubMed

Publication types

MeSH terms