. 2016;16(2):1.
doi: 10.1167/16.2.1.

Neural bandwidth of veridical perception across the visual field

Neural bandwidth of veridical perception across the visual field

Michael O Wilkinson et al. J Vis. 2016.

Abstract

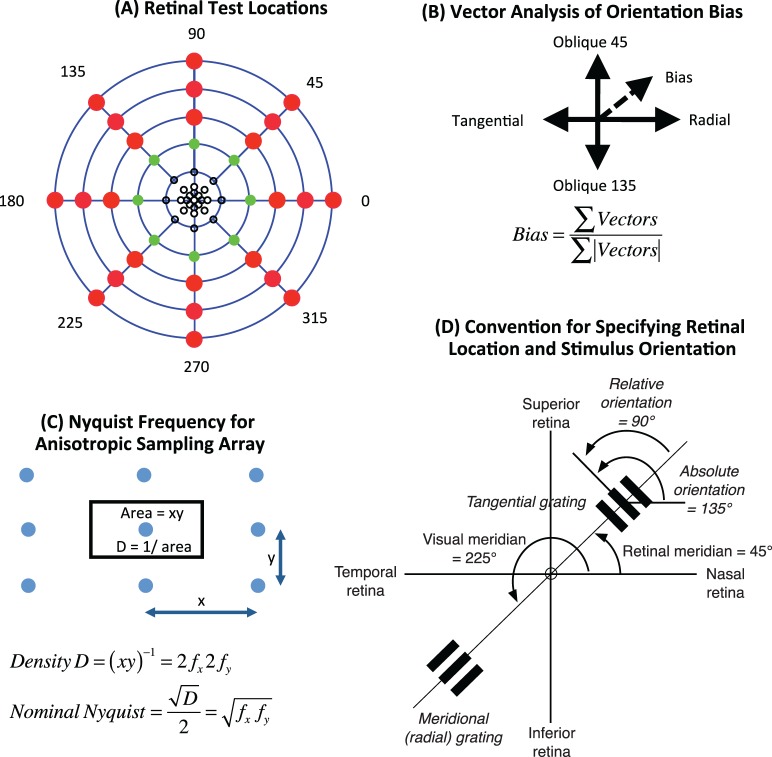
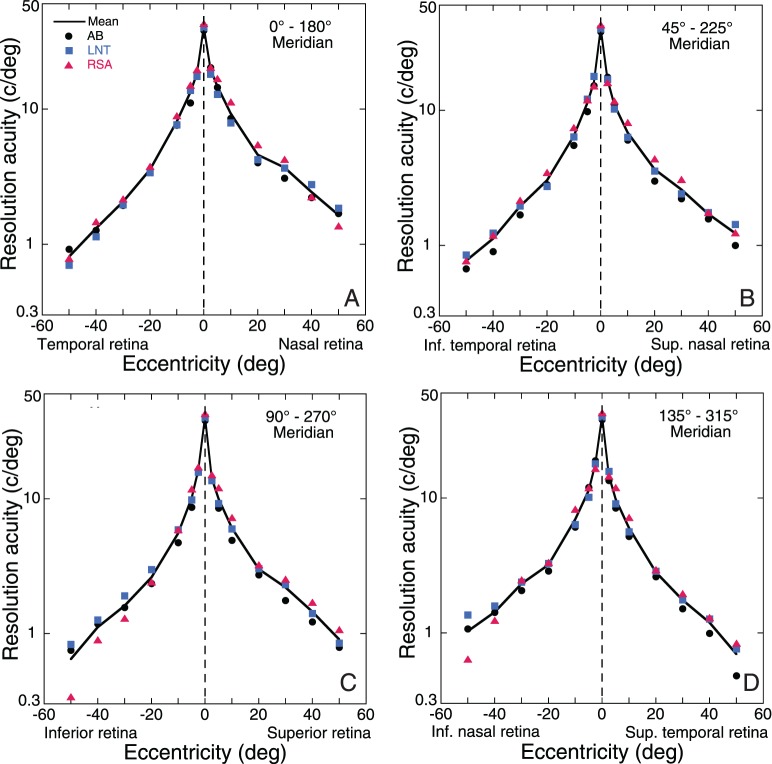
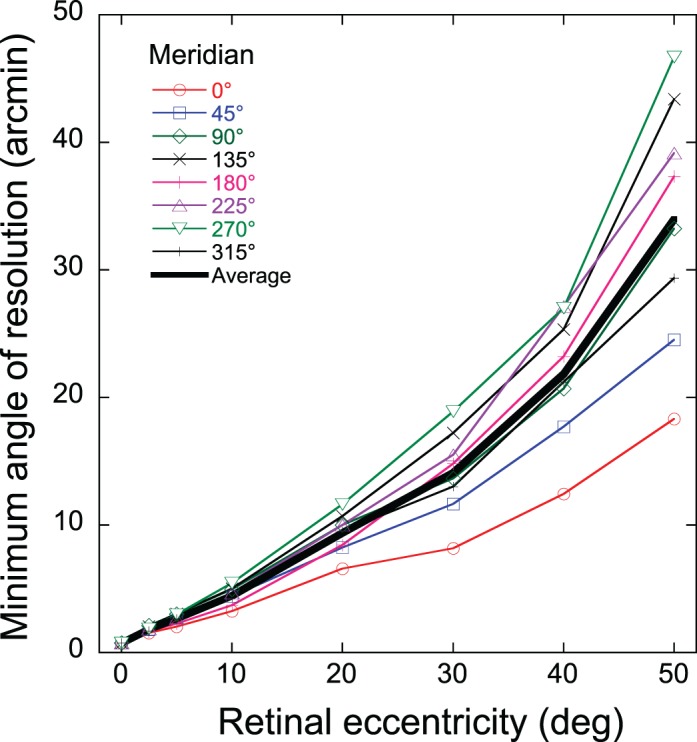
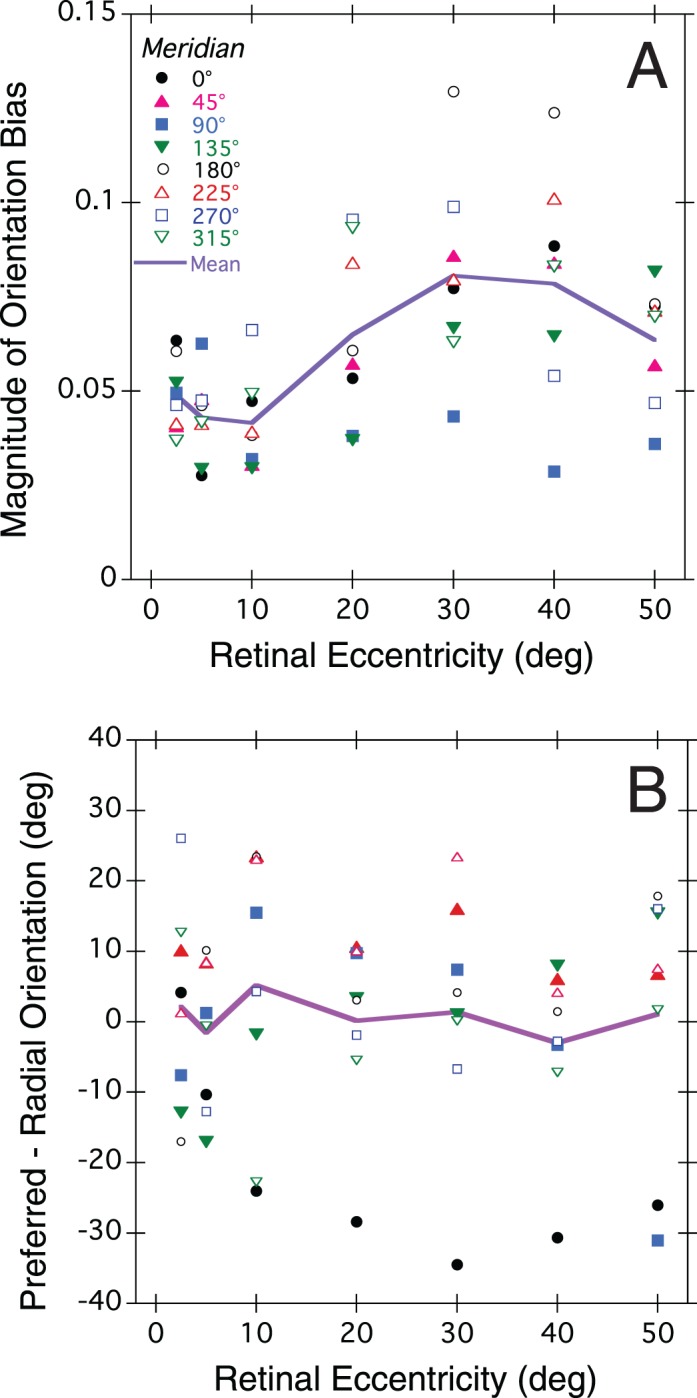
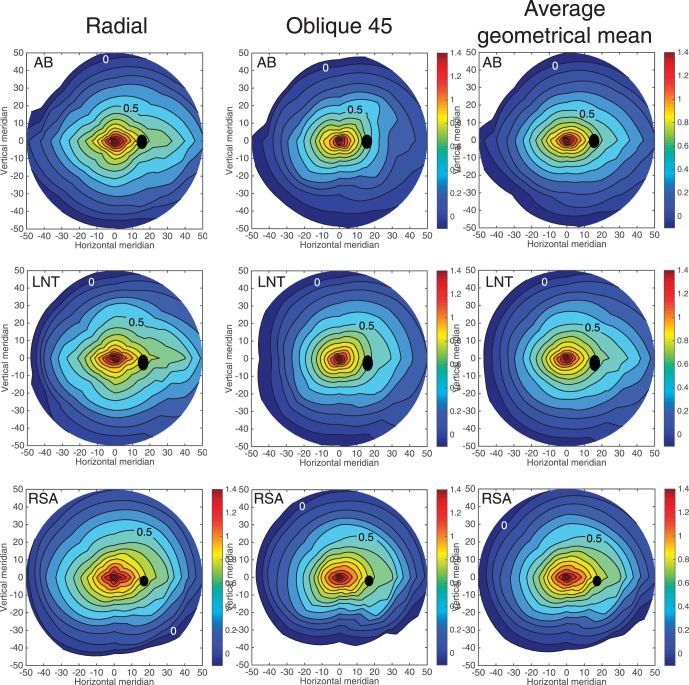
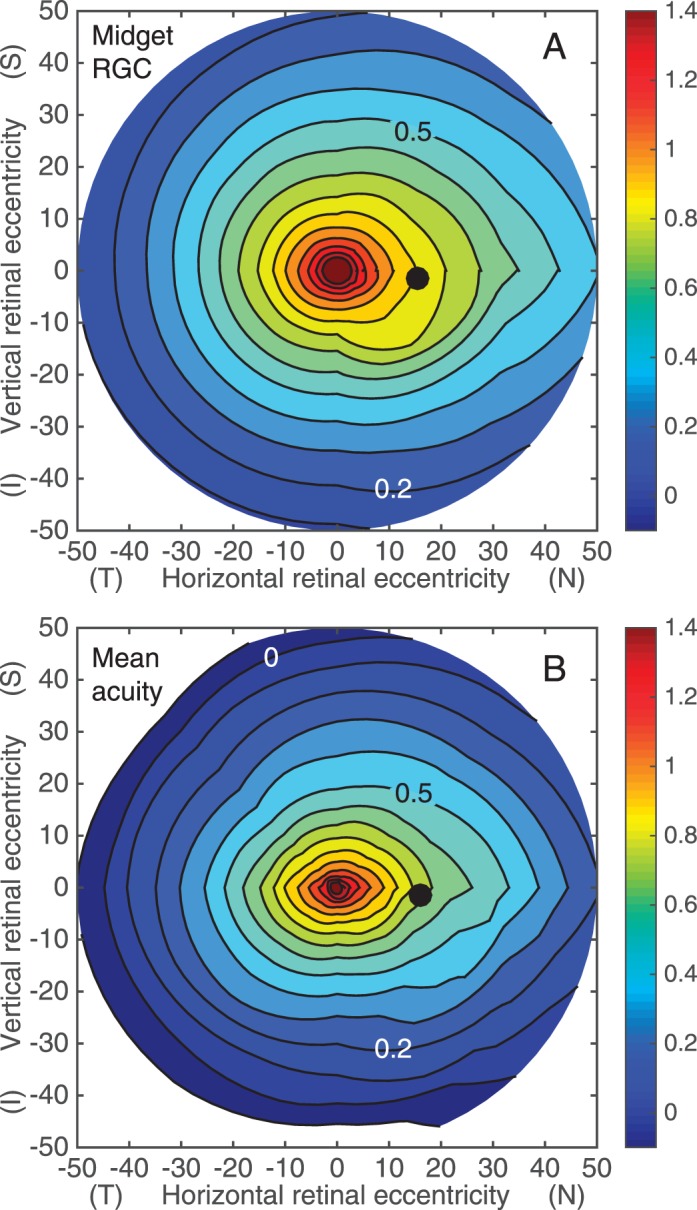
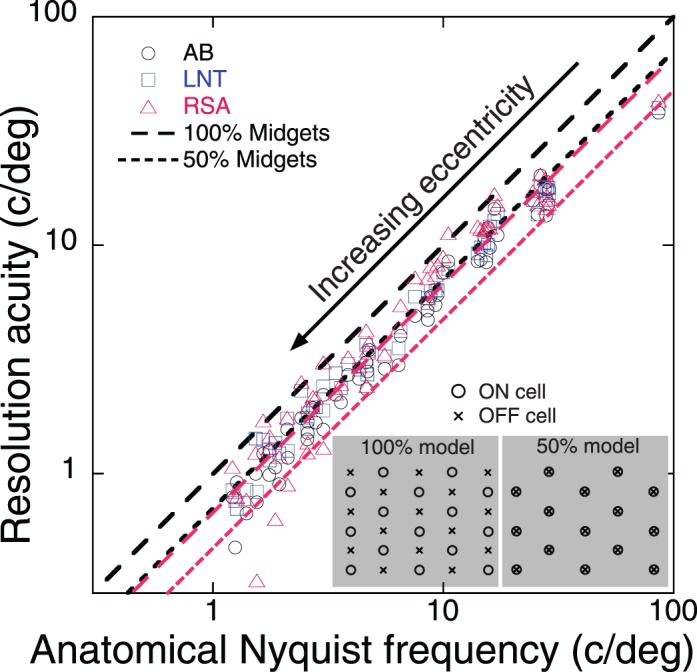
Neural undersampling of the retinal image limits the range of spatial frequencies that can be represented veridically by the array of retinal ganglion cells conveying visual information from eye to brain. Our goal was to demarcate the neural bandwidth and local anisotropy of veridical perception, unencumbered by optical imperfections of the eye, and to test competing hypotheses that might account for the results. Using monochromatic interference fringes to stimulate the retina with high-contrast sinusoidal gratings, we measured sampling-limited visual resolution along eight meridians from 0° to 50° of eccentricity. The resulting isoacuity contour maps revealed all of the expected features of the human array of retinal ganglion cells. Contours in the radial fringe maps are elongated horizontally, revealing the functional equivalent of the anatomical visual streak, and are extended into nasal retina and superior retina, indicating higher resolution along those meridians. Contours are larger in diameter for radial gratings compared to tangential or oblique gratings, indicating local anisotropy with highest bandwidth for radially oriented gratings. Comparison of these results to anatomical predictions indicates acuity is proportional to the sampling density of retinal ganglion cells everywhere in the retina. These results support the long-standing hypothesis that "pixel density" of the discrete neural image carried by the human optic nerve limits the spatial bandwidth of veridical perception at all retinal locations.


Figures

Figure 1
Figure 1
Methodological details. (A) Retinal test locations (blue rings, 10° steps in eccentricity) with symbols indicating stimulus size (1.5° black circles, 2.5° green circles, or 3.5° red circles). (B) Vector analysis of orientation bias treats acuity as a vector with magnitude = resolution spatial frequency and direction = 2× orientation of test grating. Bias is sum of vectors divided by the sum of vector lengths. (C) Nyquist frequency for an anisotropic array is the geometric mean of the Nyquist frequencies for a pair of orthogonal stimulus orientations. For the illustrated example, the x-direction is also the radial direction of stretching. (D) Convention for specifying retinal location and stimulus orientation for the right eye uses Roman typeface for terms relating to retinal location as seen by an experimenter viewing an observer's fundus. Italic typeface signifies terms relating to stimulus orientation. Meridian is measured counterclockwise from the 0° meridian (horizontal nasal retina). Absolute fringe orientation is measured by the counterclockwise angle of the bars in the fringe relative to the horizontal. Relative fringe orientation is measured from the meridian line instead of the horizontal. Radial (i.e., meridional) fringes are parallel to the meridian line and therefore have 0° relative orientation. Tangential fringes are perpendicular to the meridian line and therefore have 90° relative orientation.
Figure 2
Figure 2
Comparison of mean acuity (averaged across stimulus orientations) as a function of retinal eccentricity for all three subjects. Symbols show mean acuity for individual subjects, and the solid curve shows the population average. Standard deviations of 20 settings were typically about 10% of the mean, which suggested a logarithmic scale for the spatial frequency axis so that confidence intervals for each point would be about the same size anywhere on the graph. Confidence intervals (±2 SEM) for individual means are smaller than symbol diameter.
Figure 3
Figure 3
Variation of minimum angle of resolution with eccentricity along eight retinal meridians. Symbols show the population average (three subjects) of the geometric mean acuity computed for the radial/tangential orientations and for the 45/135 oblique orientations. The solid curve is the mean of the eight meridional curves.
Figure 4
Figure 4
Orientation bias of resolution acuity as a function of retinal eccentricity averaged across subjects. (A) Magnitude of orientation bias. (B) Preferred stimulus orientation relative to the radial orientation. Symbols show the population mean bias for individual meridians, and the solid curve shows the average bias across meridians. Symbol key in (A) applies also to (B).
Figure 5
Figure 5
Retinal contour maps of log-acuity for all three subjects. Left column of maps is for radially oriented fringes, middle column is for oblique fringes, and the right column is for the arithmetic average of the geometric means for the radial/tangential orientations and oblique orientations. Contours are spaced at 0.1 log spatial frequency intervals. For clarity, only the contours for log(1 c/°) and log(3.16 c/°) are labeled. Black circles show location and size of the blind spot caused by the optic nerve head as measured by manual perimetry for each subject. Horizontal and vertical retinal coordinates are in degrees of visual angle. Positive x-values indicate nasal retina and positive y-values indicate superior retina. Tabulated acuity data used to produce the contour maps are provided in a supplementary file.
Figure 6
Figure 6
(A) Retinal contour maps of predicted log-acuity computed from Watson's (2014) mathematical model of ON+OFF midget ganglion cell density. (B) Average across subjects of the geometrical mean acuity maps from Figure 5. Plotting conventions are the same as in Figure 5. Positive x-values indicate nasal retina and positive y-values indicate superior retina.
Figure 7
Figure 7
Comparison of measured resolution acuity (symbols) with anatomical Nyquist frequency predicted by Watson's (2014) mathematical model of midget ganglion cell density. Dashed line is the prediction for sampling by 100% of midget ganglion cells, which we argue is appropriate for independent arrays of ON and OFF retinal ganglion cells that sample at maximally different locations. Dotted black line is the prediction for sampling by 50% of midget ganglion cells, which is appropriate for identical arrays of ON and OFF cells that sample the same retinal locations. Insets provide schematic diagrams of the two models. Red lines represent adjusted models for which the two black reference lines are shifted downward together so the 50% model fits the foveal data.
Figure 8
Figure 8
Simulation of the neural image carried by retinal ganglion cell axons of the optic nerve. (A, top panel) Original scene contained in a narrow strip of horizontal visual field extending from the fovea (far left) to mid periphery (30° eccentricity, far right). (B, bottom panel) The simulated neural image rendered in a uniform space containing one pixel per neuron. To create the simulation, an initially square sampling array was stretched exponentially in the horizontal direction to produce a space-variant array with horizontal spacing between adjacent cells proportional to eccentricity. Aliasing due to undersampling is evident in the misrepresentation of the zebra's stripes. Peripheral compression of the scene (i.e., “cortical magnification”) is another functionally important consequence of logarithmic space-variant sampling.

References

    1. Anderson R. S. (1996). Aliasing in peripheral vision for counterphase gratings. Journal of the Optical Society of America A : Optics, Image Science, and Vision 13 , 2288– 2293. - PubMed
    1. Anderson R. S., Evans D. W., Thibos L. N.. (1996). Effect of window size on detection acuity and resolution acuity for sinusoidal gratings in central and peripheral vision. Journal of the Optical Society of America A : Optics, Image Science, and Vision, 13 , 697– 706. - PubMed
    1. Anderson R. S., O'Brien C.. (1997). Psychophysical evidence for a selective loss of M ganglion cells in glaucoma. Vision Research , 37, 1079– 1083, doi:S0042-6989(96)00260-X [pii]. - PubMed
    1. Anderson R. S., Thibos L. N.. (1999. a). Relationship between acuity for gratings and for tumbling-E letters in peripheral vision. Journal of the Optical Society of America, A: Optics, Image Science, and Vision , 16 , 2321– 2333. - PubMed
    1. Anderson R. S., Thibos L. N.. (1999. b). Sampling limits and critical bandwidth for letter discrimination in peripheral vision. Journal of the Optical Society of America, A: Optics, Image Science, and Vision , 16 , 2334– 2342. - PubMed

Publication types

LinkOut - more resources