. 2016 Jan 28;164(3):420-32.
doi: 10.1016/j.cell.2015.12.020.

Electron Transport Chain Remodeling by GSK3 during Oogenesis Connects Nutrient State to Reproduction

Affiliations

Electron Transport Chain Remodeling by GSK3 during Oogenesis Connects Nutrient State to Reproduction

Matthew H Sieber et al. Cell. .

Abstract

Reproduction is heavily influenced by nutrition and metabolic state. Many common reproductive disorders in humans are associated with diabetes and metabolic syndrome. We characterized the metabolic mechanisms that support oogenesis and found that mitochondria in mature Drosophila oocytes enter a low-activity state of respiratory quiescence by remodeling the electron transport chain (ETC). This shift in mitochondrial function leads to extensive glycogen accumulation late in oogenesis and is required for the developmental competence of the oocyte. Decreased insulin signaling initiates ETC remodeling and mitochondrial respiratory quiescence through glycogen synthase kinase 3 (GSK3). Intriguingly, we observed similar ETC remodeling and glycogen uptake in maturing Xenopus oocytes, suggesting that these processes are evolutionarily conserved aspects of oocyte development. Our studies reveal an important link between metabolism and oocyte maturation.


Conflict of interest statement

Conflict of interest: The authors declare no conflict of interest.

Figures

Figure 1
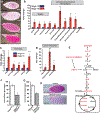
Figure 1. A shift in glycolysis and gluconeogenesis drives glycogen accumulation in oocytes.
A) Periodic acid Schiff’s staining of glycogen in Drosophila follicles. Scale bar = 50 μm. B) GC/MS measurements of select glycolytic intermediates and sugars from stage 10 and stage 14 follicles. C) GC/MS measurements of TCA cycle intermediates from stage 10 and stage 14 follicles. D) GC/MS measurements of the by products of purine breakdown from stage 10 and stage 14 follicles. E) Model of both the glycolysis and TCA pathways. Highlighted in red are the compounds that increased at least 3 fold in stage 14 oocytes. F) Colorimetric glycogen measurements of stage 14 oocytes from pepckGS/pepckGS mutant females. G) Colorimetric glycogen measurements of stage 14 oocytes from DNaseIIlo/DNaseIIlo mutant females. H) PAS staining of oocytes from DNaseIIlo/DNaseIIlo mutant females Error bars represent standard deviation. * P<.05 **P <.005.
Figure 2
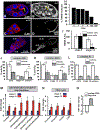
Figure 2. Mitochondria enter a low energy state of respiratory quiescence to promote glycogen storage in late oogenesis
A, C, E) Ovaries from Oregon R females fixed and stained with ATP5a antibodies (red) and DAPI (blue). B, D,F) Ovaries from Oregon R females were stained with the mitochondrial membrane potential stain TMRE G) Stage-specific quantification of the % of TMRE Nurse cells from wild type ovarioles. H) quantification of TMRE fluorescence from stage 8 and stage 14 follicle cells and nurse cells. I) Complex I and III compound activity from early follicles, stage 14 oocytes, and 12–16hr embryos. J) Complex II and III compound activity from early follicles, stage 14 oocytes, and 12–16hr embryos. (K) Complex II and III compound activity from early follicles, stage 14 oocytes, and 12–16hr embryos. GC/MS measurements of glycolytic (L) and TCA cycle (M) intermediates from stage 8 and stage 10 follicles. (N) qPCR quantification of mitochondrial genome number from early follicles and stage 14 oocytes. Error bars represent standard deviation. * P<.05 **P <.005.
Figure 3
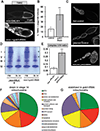
Figure 3. ETC remodeling drives mitochondrial respiratory quiescence
A) Blue native PAGE of mitochondria from early-stage follicles and stage 14 oocytes. B) Blue native PAGE of isolated mitochondria from stage 14 oocytes and 12–16 hr embryos. C) Quantification of the ratio of complex I /complex IV from early follicles, stage 14 oocytes, and 12–16hr embryos. D) Quantification of the ratio of complex V /complex IV from early follicles, stage 14 oocytes, and 12–16 hr embryos. E) Native western blot of ATP5a from early-stage follicles, stage 14 oocytes, and 12–16 hr embryos. F) Whole oocyte western blots of select mitochondrial proteins: ATP5a, NDUF3, COX IV, CYTOCHROME C, PORIN and the loading controls ACTIN and TUBULIN from early-stage follicles, stage 14 oocytes, and 12–16 hr embryo samples. G) Western blots of isolated mitochondria from early-stage follicles, stage 14 oocytes, and 12–16 hr embryo samples. H) Electron microscope images of mitochondria from stage 8, stage 14 oocytes, and embryos. Error bars represent standard deviation. * P<.05 **P <.005.
Figure 4
Figure 4. Insulin regulates the timing of glycogen accumulation and mitochondrial depolarization
A) Periodic acid Schiff’s staining (glycogen) of nos-GAL4/+ control and nos->InR-RNAi ovarioles. B) TMRE staining and DIC images of nos-GAL4/+ control and nos->InR-RNAi ovarioles. C) Depicts the % of ovarioles that display premature glycogen accumulation from nos-GAL4/+ control, nos–Akt-RNA, nos–InR-RNA#1, and nos–InR-RNA#2 females. D) Depicts the percentage of ovarioles that displayed a high level of mitochondrial membrane potential in nos-GAL4/+ control, nos–Akt-RNA, nos–InR-RNA#1, and nos–InR-RNA#2 ovarioles. E) Normalized glycogen levels measured by colorimetric assay from nos-GAL4/+ control and nos–InR-DN stage 14 oocytes. F) Normalized triglyceride levels measured by colorimetric assay from nos-GAL4/+ control and nos–InR-DN stage 14 oocytes. G) p-AKT and AKT westerns from early-stage follicles, stage 14 oocytes, and 12–16 hr embryo samples. (H) Quantification of p-AKT/AKT ratios from early stage follicles, stage 14 oocytes, and embryos. Error bars represent standard deviation. * P<.05 **P <.005.
Figure 5
Figure 5. Akt target genes are required for glycogen storage in stage 14 oocytes.
A) Glycogen levels were measured by colorimetric assay and normalized to total protein from the indicated genotypes. The results are displayed as a percentage of the wild type control of each experiment. B) Colorimetric triglyceride measurements of stage 14 oocytes from foxo21/foxo25 mutant females. Glycogen (C) and triglyceride (D) levels were measured by colorimetric assay and normalized to total protein from nos-GAL4/+, UAS-gsk3-RNAi/+, and nos–gsk3-RNAi stage 14 oocytes. E) Percent hatching of embryos from nos-GAL4/+, UAS-gsk3-RNAi/+, and nos–gsk3-RNAi stage 14 females. Error bars represent 1xSD. * P<.05 **P <.005.
Figure 6
Figure 6. GSK3 promotes mitochondria respiratory quiescence
A) TMRE staining and DIC images of nos-GAL4/+ control and nos–GSK3-RNAi stage 10B follicles. B) Quantification the percentage of stage 10B follicles that exhibit high nurse cell mitochondrial membrane potential in control and gsk3-RNAI follicles. C) Mitochondrial membrane potential staining (TMRE) from: control fed, control starved, and gsk3-RNAi starved ovarioles. D) Blue native PAGE of mitochondria from nos-GAL4/+ and nos–gsk3-RNAi stage 14 oocytes and dissected flight muscle (FM). E) Quantification of the ratio of complex I/complex IV from nos-GAL4/+ and nos–gsk3-RNAi stage 14 oocytes. (F) Venn diagram of processes involving proteins found to be decrease in mitochondria from stage 14 oocytes. Each process is proportional to the number of effected proteins. (G) Venn diagram processes involving proteins found to be stabilized in mitochondria from stage 14 GSK3-RNAi oocytes. Error bars represent standard deviation. * P<.05 **P <.005.
Figure 7
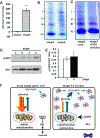
Figure 7. Insulin regulation of ETC remodeling is conserved in vertebrate oocytes.
A) Total glycogen levels measured by colorimetric assay from stage 3 and stage 6 Xenopus oocytes. Data are expressed as fold change relative to stage 3 glycogen levels. Error bars represent 1xSD. * P<.05 **P <.005. B) Blue native PAGE of mitochondria from stage 3 and stage 6 Xenopus oocytes. C) Blue native PAGE of mitochondria from vehicle-treated and 10uM wortmannin (PI3-Kinase inhibitor)-treated stage 3 Xenopus oocytes. (D) Western blots assaying p-AKT and AKT levels in stage 3 and stage 6 Xenopus oocytes. E) Quantification of the ratio of p-Akt/Akt calculated from western blots of stage 3 and stage 6 Xenopus oocytes. F) Model of germline mitochondrial quiescence and glycogen accumulation.

References

    1. Acevedo N, Ding J, and Smith GD (2007). Insulin signaling in mouse oocytes. Biol Reprod 77, 872–879. - PubMed
    1. Arden KC (2004). FoxO: linking new signaling pathways. Mol Cell 14, 416–418. - PubMed
    1. Barri PN, Coroleu B, Clua E, Tur R, Boada M, and Rodriguez I (2014). Investigations into implantation failure in oocyte-donation recipients. Reprod Biomed Online 28, 99–105. - PubMed
    1. Barthel A, Schmoll D, and Unterman TG (2005). FoxO proteins in insulin action and metabolism. Trends Endocrinol Metab 16, 183–189. - PubMed
    1. Bass BP, Tanner EA, Mateos San Martin D, Blute T, Kinser RD, Dolph PJ, and McCall K (2009). Cell-autonomous requirement for DNaseII in nonapoptotic cell death. Cell Death Differ 16, 1362–1371. - PMC - PubMed

Publication types

MeSH terms