

Molecular Profiling Reveals Biologically Discrete Subsets and Pathways of Progression in Diffuse Glioma
- PMID: 26824661
- PMCID: PMC4754110
- DOI: 10.1016/j.cell.2015.12.028
Molecular Profiling Reveals Biologically Discrete Subsets and Pathways of Progression in Diffuse Glioma
Abstract
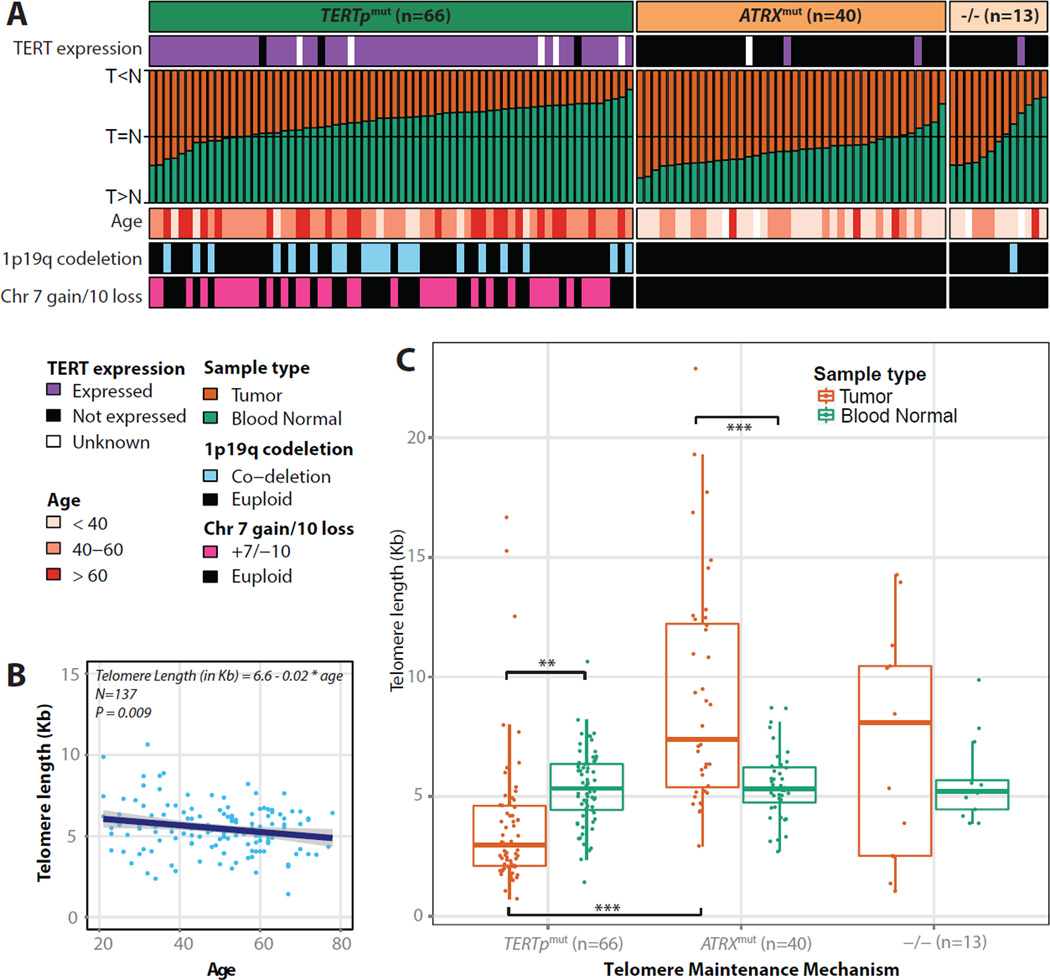
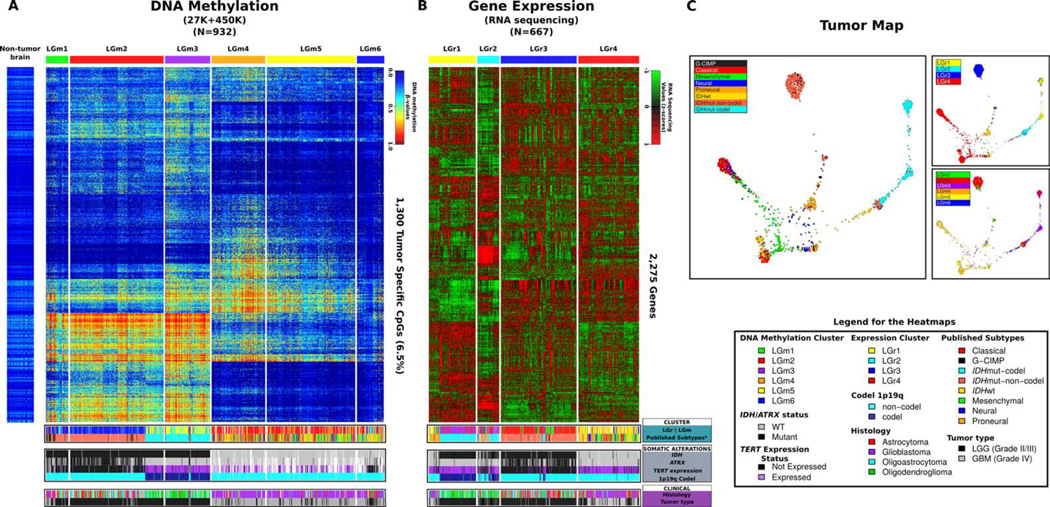
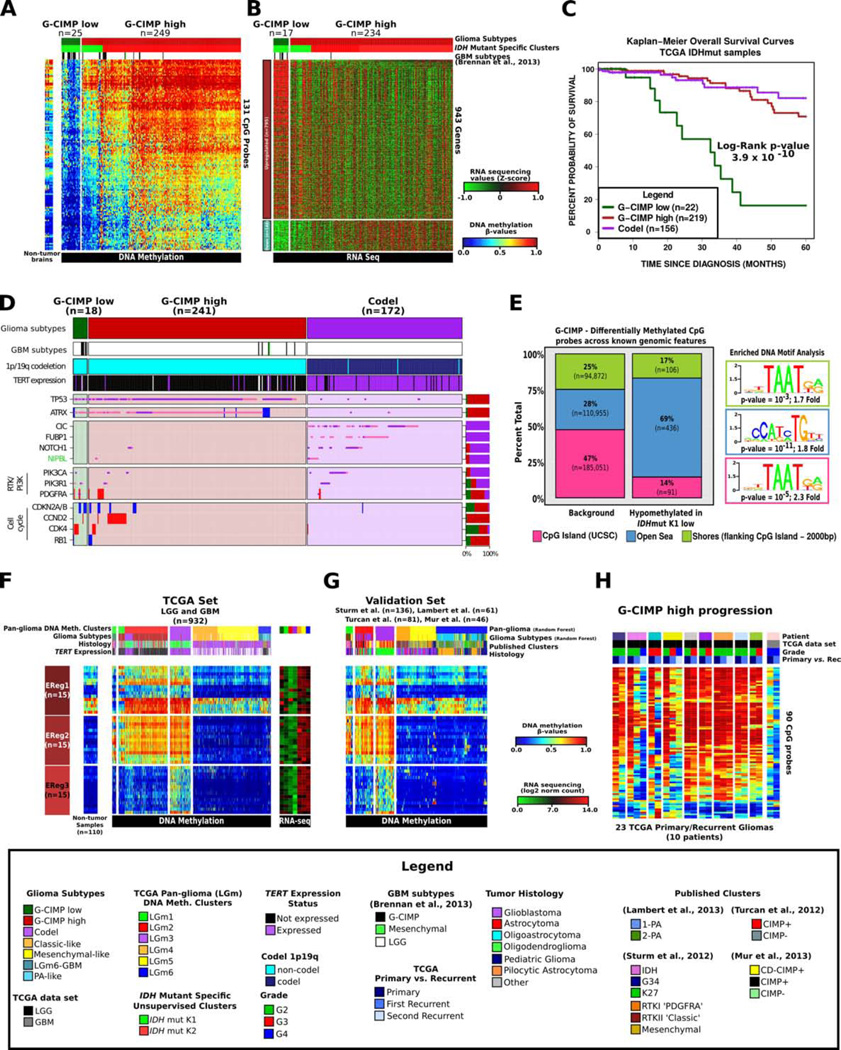
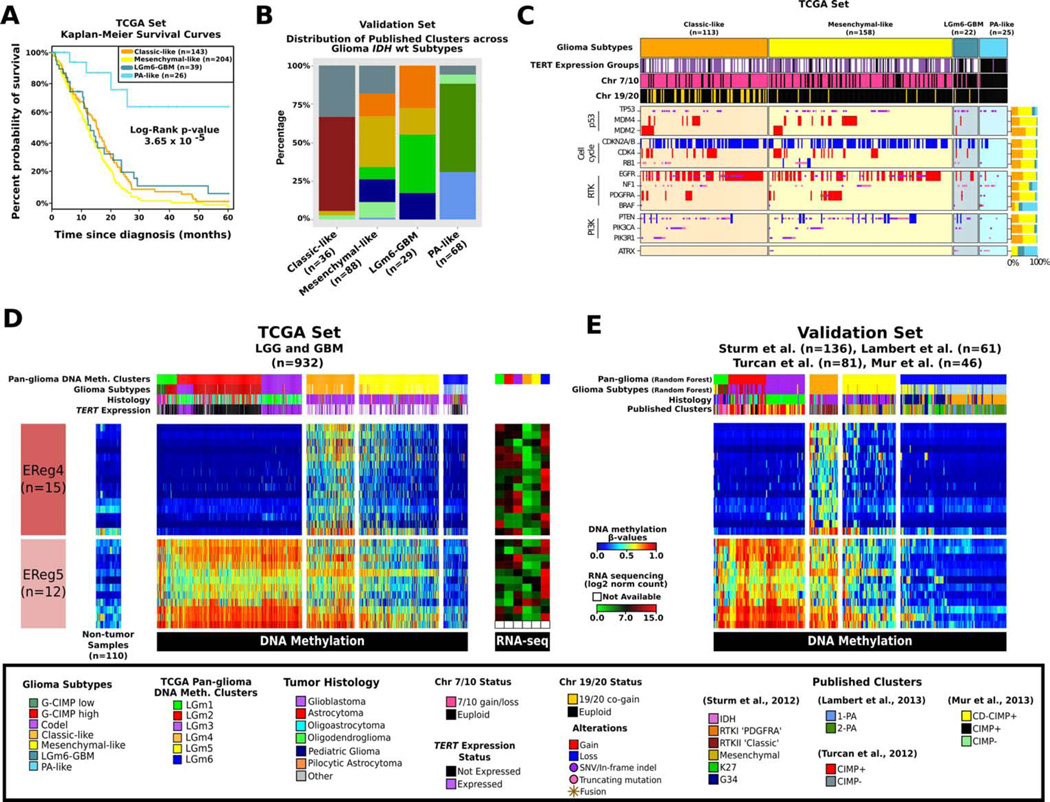
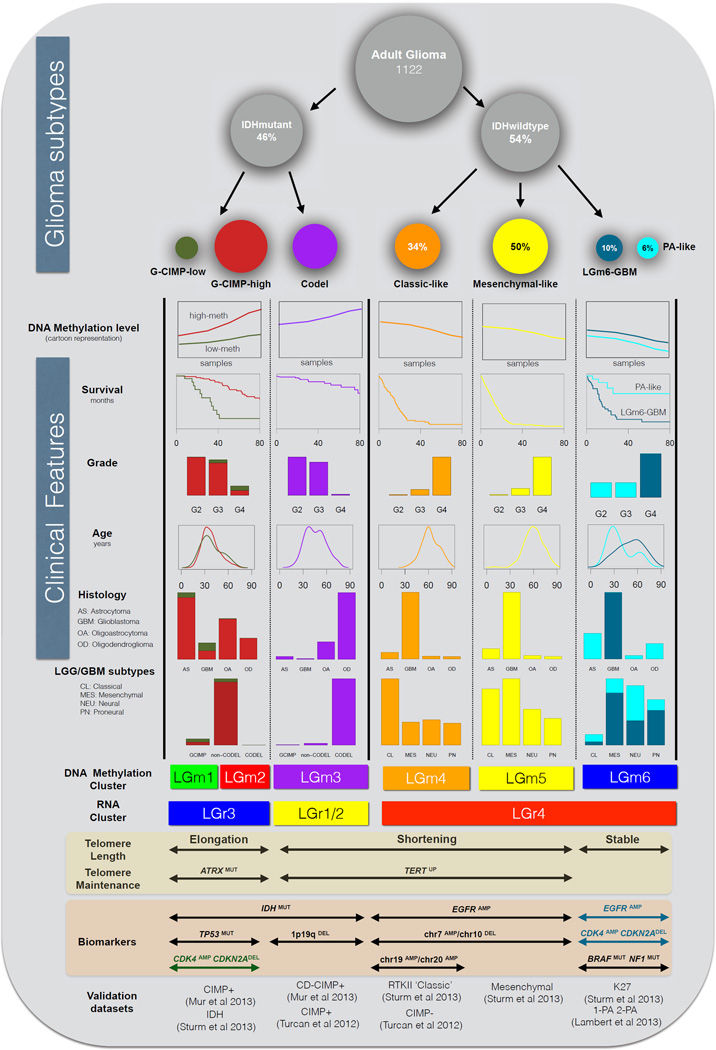
Therapy development for adult diffuse glioma is hindered by incomplete knowledge of somatic glioma driving alterations and suboptimal disease classification. We defined the complete set of genes associated with 1,122 diffuse grade II-III-IV gliomas from The Cancer Genome Atlas and used molecular profiles to improve disease classification, identify molecular correlations, and provide insights into the progression from low- to high-grade disease. Whole-genome sequencing data analysis determined that ATRX but not TERT promoter mutations are associated with increased telomere length. Recent advances in glioma classification based on IDH mutation and 1p/19q co-deletion status were recapitulated through analysis of DNA methylation profiles, which identified clinically relevant molecular subsets. A subtype of IDH mutant glioma was associated with DNA demethylation and poor outcome; a group of IDH-wild-type diffuse glioma showed molecular similarity to pilocytic astrocytoma and relatively favorable survival. Understanding of cohesive disease groups may aid improved clinical outcomes.
Copyright © 2016 Elsevier Inc. All rights reserved.
Figures
References
-
- Berman BP, Weisenberger DJ, Aman JF, Hinoue T, Ramjan Z, Liu Y, Noushmehr H, Lange CP, van Dijk CM, Tollenaar RA, et al. Regions of focal DNA hypermethylation and long-range hypomethylation in colorectal cancer coincide with nuclear lamina-associated domains. Nat Genet. 2012;44:40–46. - PMC - PubMed
-
- Chi AS, Batchelor TT, Yang D, Dias-Santagata D, Borger DR, Ellisen LW, Iafrate AJ, Louis DN. BRAF V600E mutation identifies a subset of low-grade diffusely infiltrating gliomas in adults. Journal of clinical oncology : official journal of the American Society of Clinical Oncology. 2013;31:e233–e236. - PubMed
Publication types
MeSH terms
Substances
Grants and funding
- U24CA143840/CA/NCI NIH HHS/United States
- R01 CA176659/CA/NCI NIH HHS/United States
- R01 CA188743/CA/NCI NIH HHS/United States
- R01CA185486/CA/NCI NIH HHS/United States
- U24CA126561/CA/NCI NIH HHS/United States
- P30 CA016672/CA/NCI NIH HHS/United States
- U24 CA143882/CA/NCI NIH HHS/United States
- R01 CA185486/CA/NCI NIH HHS/United States
- U54 HG003067/HG/NHGRI NIH HHS/United States
- U54HG003273/HG/NHGRI NIH HHS/United States
- U24 CA143835/CA/NCI NIH HHS/United States
- R01 CA190121/CA/NCI NIH HHS/United States
- U24CA143731/CA/NCI NIH HHS/United States
- R01 CA179044/CA/NCI NIH HHS/United States
- U24CA126551/CA/NCI NIH HHS/United States
- U24CA126543/CA/NCI NIH HHS/United States
- U24CA126554/CA/NCI NIH HHS/United States
- U24 CA143866/CA/NCI NIH HHS/United States
- U24CA143858/CA/NCI NIH HHS/United States
- U24CA126544/CA/NCI NIH HHS/United States
- P30CA016672/CA/NCI NIH HHS/United States
- U24CA143882/CA/NCI NIH HHS/United States
- U24 CA126551/CA/NCI NIH HHS/United States
- U24CA144025/CA/NCI NIH HHS/United States
- U54CA193313/CA/NCI NIH HHS/United States
- U54HG003067/HG/NHGRI NIH HHS/United States
- U24 CA143845/CA/NCI NIH HHS/United States
- U24 CA143799/CA/NCI NIH HHS/United States
- T32 GM007753/GM/NIGMS NIH HHS/United States
- U54 HG003273/HG/NHGRI NIH HHS/United States
- P30 CA008748/CA/NCI NIH HHS/United States
- U24 CA144025/CA/NCI NIH HHS/United States
- U24CA143883/CA/NCI NIH HHS/United States
- U54HG003079/HG/NHGRI NIH HHS/United States
- U24 CA126554/CA/NCI NIH HHS/United States
- U24 CA180951/CA/NCI NIH HHS/United States
- U24 CA143840/CA/NCI NIH HHS/United States
- U24 CA143843/CA/NCI NIH HHS/United States
- P50 CA097257/CA/NCI NIH HHS/United States
- U24CA143867/CA/NCI NIH HHS/United States
- R01CA179044/CA/NCI NIH HHS/United States
- U24CA143835/CA/NCI NIH HHS/United States
- U24 CA126561/CA/NCI NIH HHS/United States
- U24 CA143858/CA/NCI NIH HHS/United States
- U54 CA193313/CA/NCI NIH HHS/United States
- U24CA143843/CA/NCI NIH HHS/United States
- R01 NS081125/NS/NINDS NIH HHS/United States
- U24 CA143848/CA/NCI NIH HHS/United States
- U24 CA126543/CA/NCI NIH HHS/United States
- U24CA143848/CA/NCI NIH HHS/United States
- U24CA126563/CA/NCI NIH HHS/United States
- U24CA126546/CA/NCI NIH HHS/United States
- U54 HG003079/HG/NHGRI NIH HHS/United States
- U24CA143799/CA/NCI NIH HHS/United States
- U54 HG007990/HG/NHGRI NIH HHS/United States
- U24 CA143883/CA/NCI NIH HHS/United States
- F30 CA192725/CA/NCI NIH HHS/United States
- U24CA143866/CA/NCI NIH HHS/United States
- U24CA143845/CA/NCI NIH HHS/United States
- P50 CA127001/CA/NCI NIH HHS/United States
- P01 CA085878/CA/NCI NIH HHS/United States
- U24 CA143867/CA/NCI NIH HHS/United States
- U24 CA126546/CA/NCI NIH HHS/United States
- U24 CA126563/CA/NCI NIH HHS/United States
- U24 CA126544/CA/NCI NIH HHS/United States
- R01 CA052689/CA/NCI NIH HHS/United States
LinkOut - more resources
Full Text Sources
Other Literature Sources
Medical
