. 2016 Jun 15;594(12):3317-38.
doi: 10.1113/JP271699. Epub 2016 Mar 11.

Spontaneous Ca(2+) transients in interstitial cells of Cajal located within the deep muscular plexus of the murine small intestine

Affiliations

Spontaneous Ca(2+) transients in interstitial cells of Cajal located within the deep muscular plexus of the murine small intestine

Salah A Baker et al. J Physiol. .

Abstract

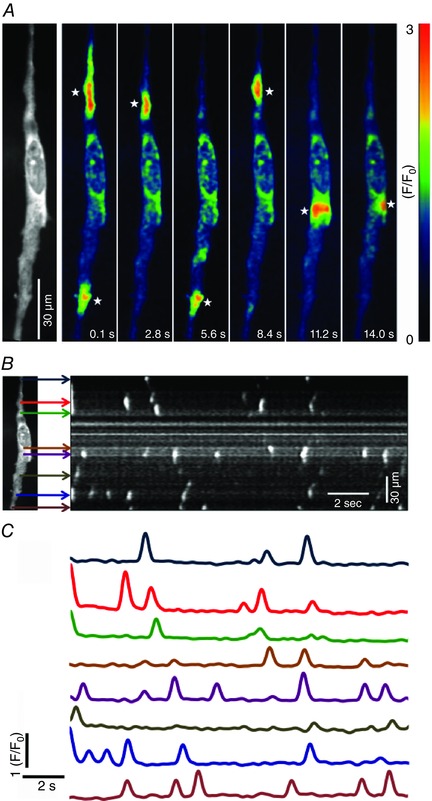
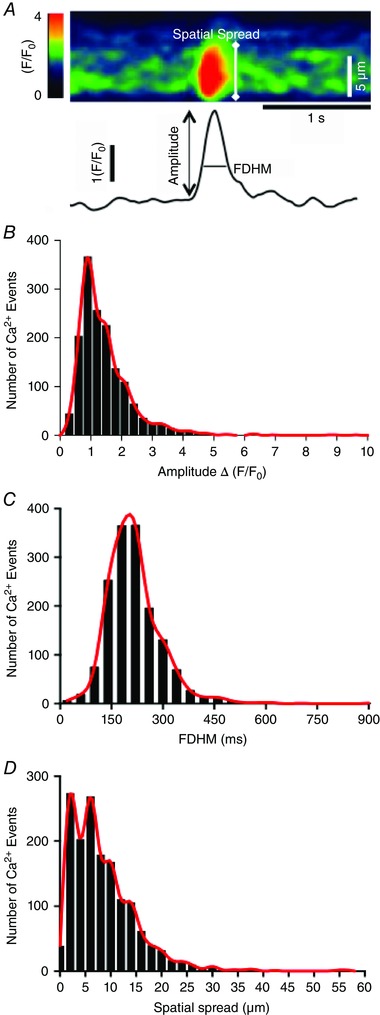
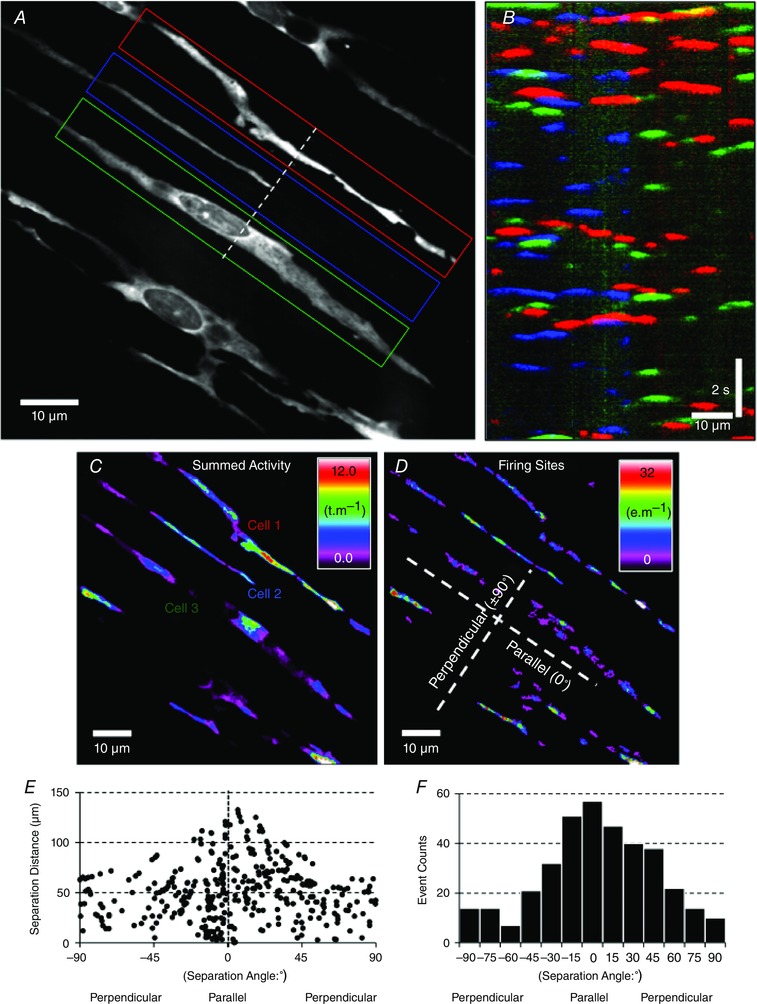
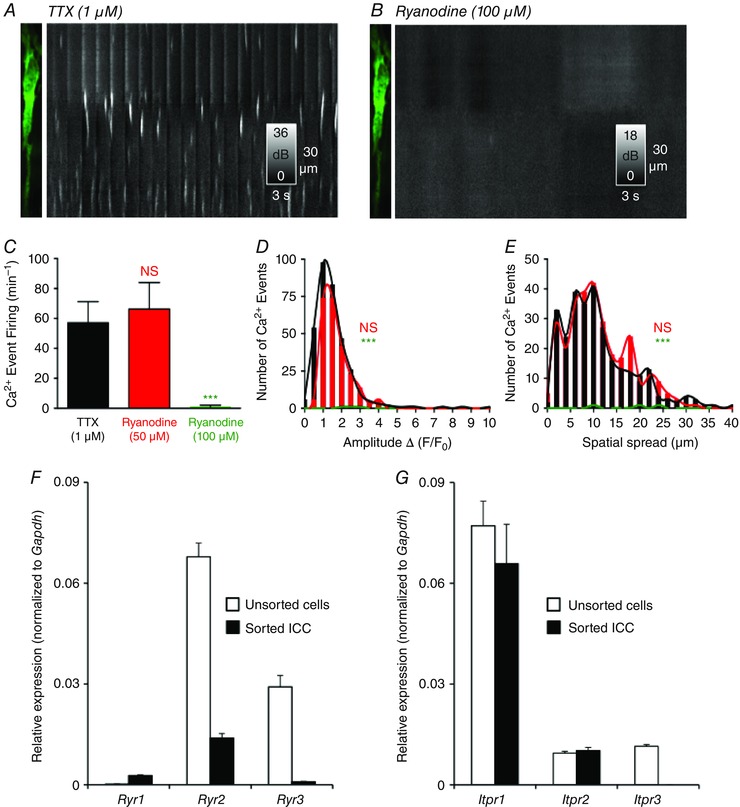
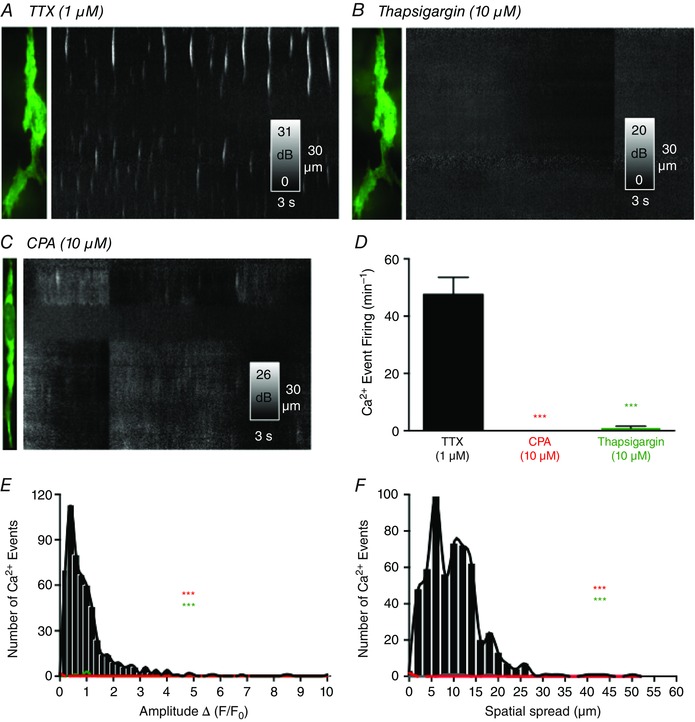
Key points: Interstitial cells of Cajal at the level of the deep muscular plexus (ICC-DMP) in the small intestine generate spontaneous Ca(2+) transients that consist of localized Ca(2+) events and limited propagating Ca(2+) waves. Ca(2+) transients in ICC-DMP display variable characteristics: from discrete, highly localized Ca(2+) transients to regionalized Ca(2+) waves with variable rates of occurrence, amplitude, duration and spatial spread. Ca(2+) transients fired stochastically, with no cellular or multicellular rhythmic activity being observed. No correlation was found between the firing sites in adjacent cells. Ca(2+) transients in ICC-DMP are suppressed by the ongoing release of inhibitory neurotransmitter(s). Functional intracellular Ca(2+) stores are essential for spontaneous Ca(2+) transients, and the sarco/endoplasmic reticulum Ca(2+) -ATPase (SERCA) pump is necessary for maintenance of spontaneity. Ca(2+) release mechanisms involve both ryanodine receptors (RyRs) and inositol triphosphate receptors (InsP3 Rs). Release from these channels is interdependent. ICC express transcripts of multiple RyRs and InsP3 Rs, with Itpr1 and Ryr2 subtypes displaying the highest expression.

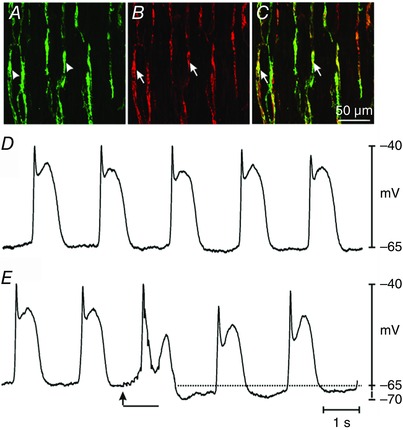
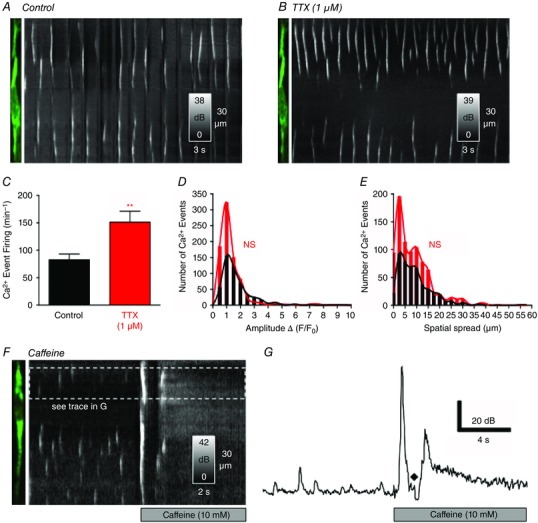
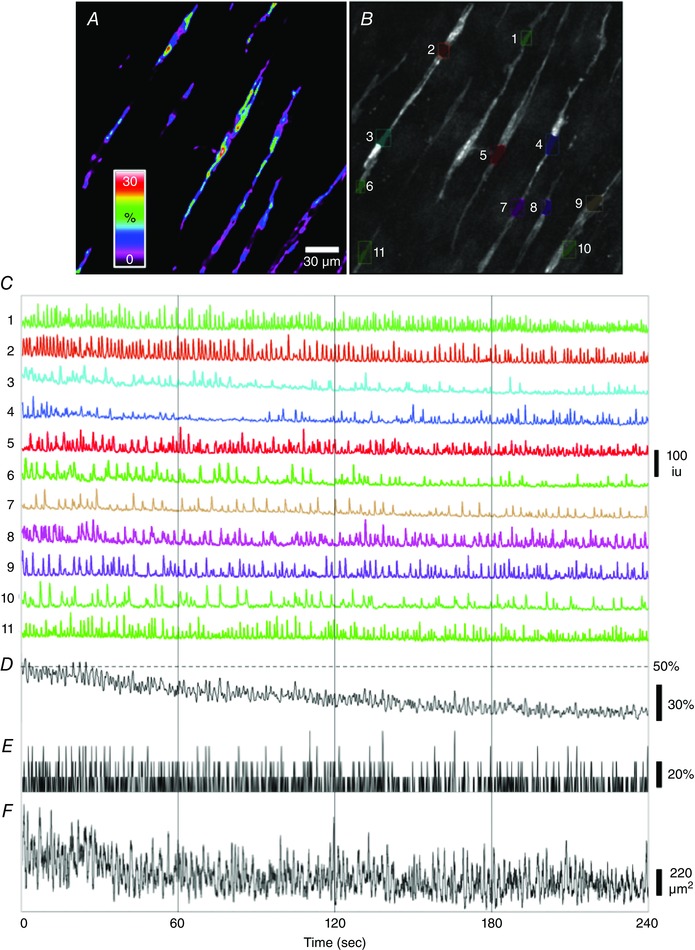
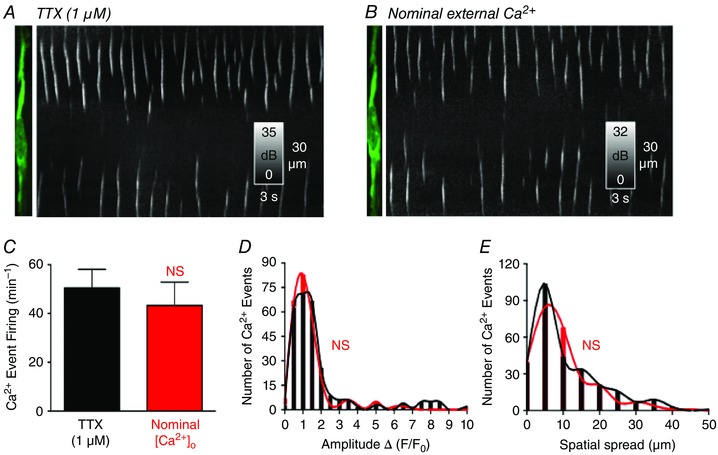
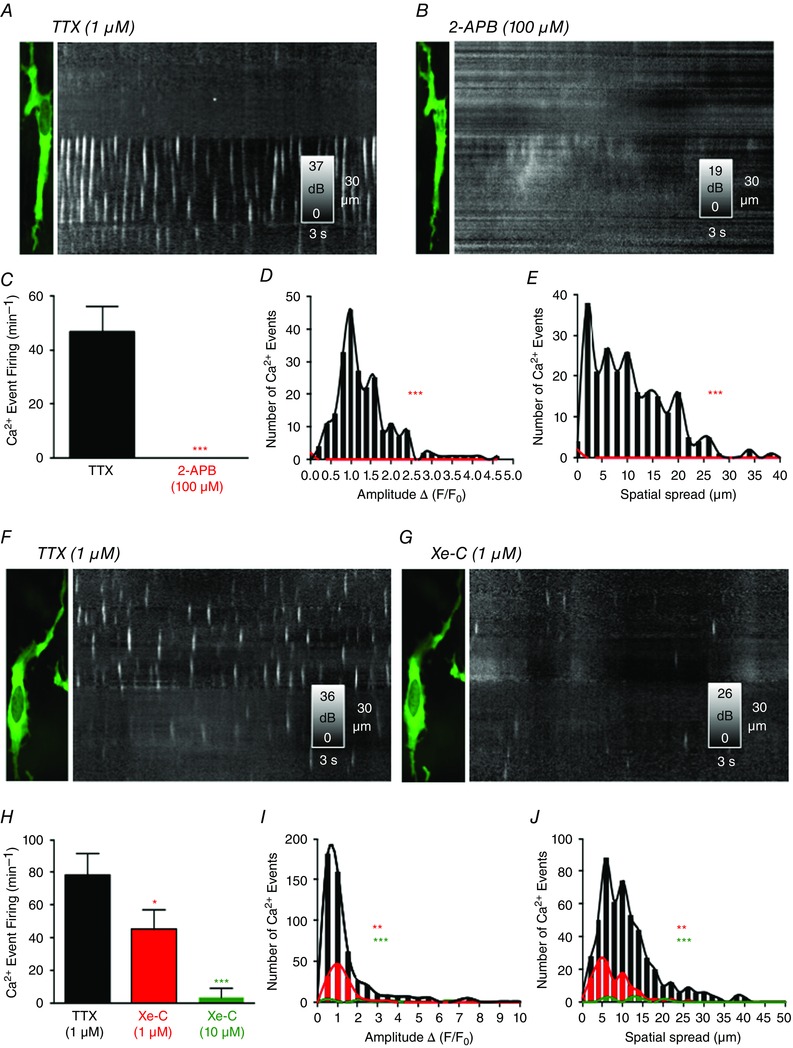
Abstract: Interstitial cells of Cajal in the deep muscular plexus of the small intestine (ICC-DMP) are closely associated with varicosities of enteric motor neurons and generate responses contributing to neural regulation of intestinal motility. Responses of ICC-DMP are mediated by activation of Ca(2+) -activated Cl(-) channels; thus, Ca(2+) signalling is central to the behaviours of these cells. Confocal imaging was used to characterize the nature and mechanisms of Ca(2+) transients in ICC-DMP within intact jejunal muscles expressing a genetically encoded Ca(2+) indicator (GCaMP3) selectively in ICC. ICC-DMP displayed spontaneous Ca(2+) transients that ranged from discrete, localized events to waves that propagated over variable distances. The occurrence of Ca(2+) transients was highly variable, and it was determined that firing was stochastic in nature. Ca(2+) transients were tabulated in multiple cells within fields of view, and no correlation was found between the events in adjacent cells. TTX (1 μm) significantly increased the occurrence of Ca(2+) transients, suggesting that ICC-DMP contributes to the tonic inhibition conveyed by ongoing activity of inhibitory motor neurons. Ca(2+) transients were minimally affected after 12 min in Ca(2+) free solution, indicating these events do not depend immediately upon Ca(2+) influx. However, inhibitors of sarco/endoplasmic reticulum Ca(2+) -ATPase (SERCA) pump and blockers of inositol triphosphate receptor (InsP3 R) and ryanodine receptor (RyR) channels blocked ICC Ca(2+) transients. These data suggest an interdependence between RyR and InsP3 R in the generation of Ca(2+) transients. Itpr1 and Ryr2 were the dominant transcripts expressed by ICC. These findings provide the first high-resolution recording of the subcellular Ca(2+) dynamics that control the behaviour of ICC-DMP in situ.


Figures

Figure 1
Figure 1. Kit‐Cre‐GCaMP3 was expressed in ICC‐DMP and mice expressing the Ca2+ indicator displayed slow waves and responses to intrinsic nerve stimulation
A, digital reconstruction of a confocal image of GFP+ cells at the level of the DMP region (arrowheads, green) in the jejunum. B, c‐Kit+ cells (i.e. identifying marker for ICC‐DMP; arrows; red). C, merged image of A and B revealing co‐localization of GFP and c‐Kit (arrows; yellow). All c‐Kit+ cells expressed GFP (i.e. identifying expression of GCaMP3). The confocal images are digital reconstructions of single optical slices (1.0 μm in thickness). Scale bar in C applies to A to C. D, slow waves of normal amplitude and frequency recorded from a jejunal muscle strip from a Kit‐Cre‐GCaMP3 mouse. E, postjunctional responses to EFS (10 Hz; 0.5 ms duration pulses for 1 s; EFS initiated at the arrow for the duration of the solid black bar). EFS caused attenuation of slow waves immediately after initiation of stimulation and hyperpolarization, persisting for several seconds, after termination of EFS (dotted line).
Figure 2
Figure 2. ICC‐DMP generate spontaneous Ca2+ transients in situ
A, representative Ca2+ fluorescence intensity time‐series images taken from a single ICC‐DMP in situ (actual fluorescence image of the cell shown in the first panel). Images depict spontaneous Ca2+ transients occurring at different sites within the cell as a function of time. A colour‐coded system was imported to depict fluorescence intensity (F/F 0). Low fluorescence areas are indictated in dark blue or black. High intensity fluorescence areas are indicated in red and orange. A colour calibration scale is provided in A. White stars indicate representative firing sites of Ca2+ in ICC‐DMP. Scale bar in A is 30 μm. B, ST maps were generated to map the occurrence of Ca2+ events in single ICC‐DMP. Coloured arrows indicate the discrete firing sites observed in a representative cell (one frame of a fluorescence image of the cell is shown to the left in B). C, plots of Ca2+ transients at each firing site during a 15 s recording period. Colours of traces in C correspond to the firing sites indicated by the arrows of the same colours in the ST map (B).
Figure 3
Figure 3. Analysis of Ca2+ transients in ICC‐DMP
A, zoomed in portion of an ST map showing peak image of a single Ca2+ transient in an ICC‐DMP and how the spatial spread of Ca2+ events was measured. Trace below image shows the Ca2+ transient plotted as a function of time and how amplitude and duration (full duration half maximum; FDHM) of Ca2+ transients were measured. BD, histograms summarizing the range and distribution of Ca2+ transient amplitude (B), duration (C) and spatial spread (D) for hundreds of Ca2+ transients observed in ICC‐DMP (n = 16, c = 45). Red lines were fit to the histograms for clarity using a spline function from Prisim6. Comparisons between data sets were made using Mann–Whitney tests.
Figure 4
Figure 4. Asynchronous, stochastic nature of Ca2+ transients in ICC‐DMP
A, a single frame of Ca2+ fluorescence in several ICC‐DMP within a single FOV during a 15 s recording. Three adjacent cells (coded as red, blue and green regions of interest; ROIs) were selected and ST maps of the average Ca2+ fluorescence intensity across the diameter of the cell were constructed. ST maps from each cell were colour coded to correspond to the red, blue and green cells and combined into a summed ST map in B. Coincidence of intracellular Ca2+ transients (at 90° to each other), coded as yellow, cyan and magenta areas, was minimal (i.e. less than 7.25%), indicating little spatial or temporal synchronization of Ca2+ transients in adjacent cells. C, prevalence and location of all Ca2+ transient particles (see Methods) in ICC‐DMP within a FOV displayed as a heat map. D, Ca2+ transient firing sites were used to evaluate the coincidence of all Ca2+ events in ICC‐DMP within the FOV. E, the separation angle and distance between Ca2+ events in ICC‐DMP was measured and plotted, demonstrating that Ca2+ transients in single cells have a greater possibility of being coincident than events in adjacent cells (angles other than ∼0°). F, frequency histogram of the coincidence of Ca2+ transients is plotted in E.
Figure 5
Figure 5. Effects of intrinsic neural inputs on Ca2+ transients in ICC‐DMP
A, representative image of an ICC‐DMP and ST map showing spontaneous Ca2+ transients in the ICC‐DMP under control conditions (KRB perfusion of bath). B, application of TTX (1 μm) enhanced the occurrence of Ca2+ transients in the same ICC‐DMP, as shown in the ST map. C, summary data showing the increase in Ca2+ transients after the addition of TTX (**P = 0.01, n = 6). D, summary histograms showing the amplitudes of Ca2+ transients (in presence of TTX; red bars and line) compared to control conditions (black bars and line; P = 0.89, n = 6). E, summary histograms of the spatial spread of Ca2+ transients in the presence of TTX compared to control (P = 0.51, n = 6). F, application of caffeine (10 mm) elicited a global Ca2+ fluorescence rise throughout ICC‐DMP, as shown in the ST map, and the representative plot in G (♦) indicates a motion/focus artefact.
Figure 6
Figure 6. Firing pattern of spontaneous Ca2+ transients in ICC‐DMP during long recording periods
A, image of the occurrence of active Ca2+ transients in ICC‐DMP during a 4 min recording displayed as a heat map. Spectrum bar shows the percentage of overall recording time that sites were active. B, image showing a selection of ROIs of active Ca2+ transient firing sites in each ICC‐DMP (coloured ROIs, as indicated by numbers 1 to 11 in the FOV) that were used to extract changes in Ca2+‐induced fluorescence changes in every cell. C, traces of Ca2+ transients plotted as a function of time from each ICC‐DMP (coloured ROIs) in the FOV shown in B. D, shows an averaged trace of all of the Ca2+ transients in C; the amplitude of each trace was normalized between 0–100% before averaging. E, trace of the number of cells that fired at each time point during a 4 min recording (within ± 66 ms time window; see Methods). The coincidence of Ca2+ transients firing between ICC‐DMP in FOV over 4 min recordings was steady and did not show subminute fluctuations. The scale bar represents the total number of cells that fired Ca2+ transients within a ± 66 ms window over the 4 min recording period. F, trace of the overall area displaying active Ca2+ transients in all ICC‐DMP in the FOV, per frame, after the movie was differentiated (>25 dB/∆t = 0.5 s). Spikes in the trace coincided with propagating Ca2+ transients. Again, by this analysis, no subminute oscillations in the overall firing patterns in ICC‐DMP of four tissues (n = 4) were observed.
Figure 7
Figure 7. Effects of nominal extracellular Ca2+ on Ca2+ transients in ICC‐DMP
A, representative image of an ICC‐DMP and ST map showing spontaneous Ca2+ transients in the ICC‐DMP in the presence of TTX and after the addition of nominally Ca2+‐free KRB solution in B. Reducing extracellular Ca2+ did not significantly affect the occurrence of Ca2+ transients. C, summary data show that there was no significant (NS) change in the rate of occurrence of Ca2+ events in nominal Ca2+‐free KRB (P = 0.57, n = 5). D, summary histograms showing the amplitudes of Ca2+ transients in the presence of TTX (black bars and line) and after the addition of nominal Ca2+‐free KRB (red bars and line) (P = 0.4, n = 5). E, summary histograms showing the spatial spread of Ca2+ transients in the presence of TTX and after the addition of nominal Ca2+‐free KRB (P = 0.76, n = 5).
Figure 8
Figure 8. Effects of InsP3R inhibitors (2‐APB and XeC) on ICC‐DMP Ca2+ transients
A, image of ICC‐DMP and ST map of Ca2+ transients in the presence of TTX. 2‐APB (100 μm) blocked Ca2+ transients in ICC‐DMP as shown in the ST map in B. C, summary data showing the inhibitory effects of 2‐APB (100 μm) on the occurrence of Ca2+ transients (***P = 0.001, n = 5). D, comparison of amplitude histograms before (black bars and line) and after the addition of 2‐APB (***P = 0.001, n = 5; red bars and line). Histograms summarizing the spatial spread of Ca2+ transients before (black bars and line) and after the addition of 2‐APB in E (***P = 0.001, n = 5; red bars and line). F, representative image of an ICC‐DMP and an ST map of Ca2+ transients in the presence of TTX. XeC (1 μm) attenuated the occurrence of Ca2+ transients, as shown in the ST map in G. H, summary data showing the occurrence of Ca2+ transients in the presence of TTX and after the addition of XeC (1 μm and 10 μm; *P = 0.04, n = 4 and ***P = 0.001, n = 3, respectively). I, summary histograms showing the amplitudes of Ca2+ events in the presence of TTX (black bars and line) and in the presence of XeC (1 μm and 10 μm; red bars and line and green bars and line, respectively; **P = 0.01, n = 4 and ***P = 0.001, n = 3, respectively). J, summary histograms showing spatial spread of Ca2+ transients in the presence of TTX (black bars and line) and after the addition of XeC (1 μm and 10 μm; red bars and line and green bars and line, respectively; **P = 0.01, n = 4 and ***P = 0.001, n = 3, respectively).
Figure 9
Figure 9. Effects of ryanodine on Ca2+ transients in ICC‐DMP and molecular expression of RyR and InsP3R transcripts
A, image of ICC‐DMP and ST map of Ca2+ transients in the presence of TTX (1 μm). B, ryanodine (100 μm) blocked Ca2+ transients in ICC‐DMP as shown in the ST map. C, summary of occurrence of Ca2+ transients in the presence of ryanodine [50 μm; not significant (NS), P = 0.6, n = 4] and ryanodine (100 μm; ***P = 0.001, n = 4). D, histograms showing the amplitude of Ca2+ transients after the addition of ryanodine (50 μm; NS, P = 0.7, n = 4; red) or ryanodine (100 μm; green) compared to TTX alone (***P = 0.001, n = 4). E, histograms showing the spatial spread of Ca2+ transients after the addition of ryanodine (50 μm; NS, P = 0.3, n = 4) and ryanodine (100 μm) compared to TTX (***P = 0.001, n = 4). F, relative expression of RyR isoforms (Ryr1, Ryr2, Ryr3) in sorted ICC and in unsorted cells (i.e. mixed cell population after enzymatic dispersions of Jejunal muscles) as determined by qPCR. Transcripts of all three RyRs isoforms were resolved in sorted ICC; however, the highest isoform expressed in ICC was Ryr2. G, relative expression levels of InsP3R isoforms (Itpr1, Itpr2, Itpr3) in sorted ICC compared to unsorted cells. Itpr1 was the highest isoform expressed in ICC. Itpr3 expression was not resolved in ICC. The relative expression of each gene was normalized to the house‐keeping gene, Gapdh. The data are plotted with SE bars and derived from experiments on four tissues of four animals that were dispersed and sorted separately, and then qPCR was performed on each individual sample.
Figure 10
Figure 10. Effects of SERCA pump blockers on Ca2+ transients
A, ICC‐DMP image and ST map of Ca2+ transients in the presence of TTX. Thapsigargin (10 μm) blocked Ca2+ transients as shown in the ST map in B. CPA (10 μm) also blocked Ca2+ transients in ICC‐DMP. C and D, summary data showing the effects of SERCA pump inhibitors on Ca2+ transients (CPA: ***P = 0.001, n = 5; thapsigargin: ***P = 0.001, n = 5). E and F, histograms showing the amplitudes and spatial spreads of Ca2+ transients in the presence of TTX (black bars and line) and after the addition of CPA (both ***P = 0.001, n = 5; red bars and line) or thapsigargin (both ***P = 0.001, n = 5; green bars and line).

Similar articles

Cited by

References

    1. Aoyama M, Yamada A, Wang J, Ohya S, Furuzono S, Goto T, Hotta S, Ito Y, Matsubara T, Shimokata K, Chen SR, Imaizumi Y & Nakayama S (2004). Requirement of ryanodine receptors for pacemaker Ca2+ activity in ICC and HEK293 cells. J Cell Sci 117, 2813–2825. - PubMed
    1. Baker SA, Hennig GW, Salter AK, Kurahashi M, Ward SM & Sanders KM (2013). Distribution and Ca(2+) signalling of fibroblast‐like (PDGFR(+)) cells in the murine gastric fundus. J Physiol 591, 6193–6208. - PMC - PubMed
    1. Baker SA, Hennig GW, Ward SM & Sanders KM (2015). Temporal sequence of activation of cells involved in purinergic neurotransmission in the colon. J Physiol 593, 1945–1963. - PMC - PubMed
    1. Beckett EA, Horiguchi K, Khoyi M, Sanders KM & Ward SM (2002). Loss of enteric motor neurotransmission in the gastric fundus of Sl/Sl(d) mice. J Physiol 543, 871–887. - PMC - PubMed
    1. Beckett EA, Takeda Y, Yanase H, Sanders KM & Ward SM (2005). Synaptic specializations exist between enteric motor nerves and interstitial cells of Cajal in the murine stomach. J Comp Neurol 493, 193–206. - PubMed

Publication types

LinkOut - more resources