

Classification of Asthma Based on Nonlinear Analysis of Breathing Pattern
- PMID: 26824900
- PMCID: PMC4732950
- DOI: 10.1371/journal.pone.0147976
Classification of Asthma Based on Nonlinear Analysis of Breathing Pattern
Abstract
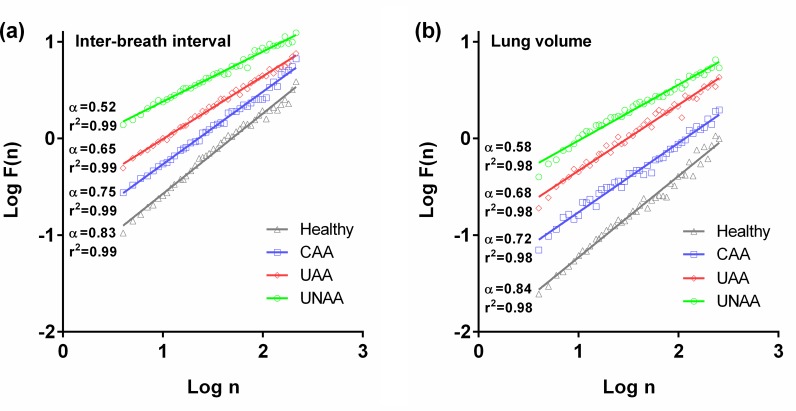
Normal human breathing exhibits complex variability in both respiratory rhythm and volume. Analyzing such nonlinear fluctuations may provide clinically relevant information in patients with complex illnesses such as asthma. We compared the cycle-by-cycle fluctuations of inter-breath interval (IBI) and lung volume (LV) among healthy volunteers and patients with various types of asthma. Continuous respiratory datasets were collected from forty age-matched men including 10 healthy volunteers, 10 patients with controlled atopic asthma, 10 patients with uncontrolled atopic asthma, and 10 patients with uncontrolled non-atopic asthma during 60 min spontaneous breathing. Complexity of breathing pattern was quantified by calculating detrended fluctuation analysis, largest Lyapunov exponents, sample entropy, and cross-sample entropy. The IBI as well as LV fluctuations showed decreased long-range correlation, increased regularity and reduced sensitivity to initial conditions in patients with asthma, particularly in uncontrolled state. Our results also showed a strong synchronization between the IBI and LV in patients with uncontrolled asthma. Receiver operating characteristic (ROC) curve analysis showed that nonlinear analysis of breathing pattern has a diagnostic value in asthma and can be used in differentiating uncontrolled from controlled and non-atopic from atopic asthma. We suggest that complexity analysis of breathing dynamics may represent a novel physiologic marker to facilitate diagnosis and management of patients with asthma. However, future studies are needed to increase the validity of the study and to improve these novel methods for better patient management.
Conflict of interest statement
Figures


Similar articles
-
Respiratory pattern complexity in newly-diagnosed asthmatic patients.Respir Physiol Neurobiol. 2022 Jun;300:103873. doi: 10.1016/j.resp.2022.103873. Epub 2022 Feb 22. Respir Physiol Neurobiol. 2022. PMID: 35217233
-
Effects of breathing patterns and light exercise on linear and nonlinear heart rate variability.Appl Physiol Nutr Metab. 2015 Aug;40(8):762-8. doi: 10.1139/apnm-2014-0493. Epub 2015 Apr 2. Appl Physiol Nutr Metab. 2015. PMID: 26187271
-
Quantifying fractal dynamics of human respiration: age and gender effects.Ann Biomed Eng. 2002 May;30(5):683-92. doi: 10.1114/1.1481053. Ann Biomed Eng. 2002. PMID: 12108842
-
Nonlinear model for estimating respiratory volume based on thoracoabdominal breathing movements.Respirology. 2013 Jan;18(1):108-16. doi: 10.1111/j.1440-1843.2012.02251.x. Respirology. 2013. PMID: 22897148
-
Entropy Change of Biological Dynamics in Asthmatic Patients and Its Diagnostic Value in Individualized Treatment: A Systematic Review.Entropy (Basel). 2018 May 24;20(6):402. doi: 10.3390/e20060402. Entropy (Basel). 2018. PMID: 33265493 Free PMC article. Review.
Cited by
-
Wearable Device-Based Respiratory Complexity Analysis for Detecting Pulmonary Congestion in Patients With Heart Failure: Observational Exploratory Study.J Med Internet Res. 2025 Aug 27;27:e73488. doi: 10.2196/73488. J Med Internet Res. 2025. PMID: 40865122 Free PMC article.
-
Heart rhythm characterization through induced physiological variables.Sci Rep. 2017 Jul 11;7(1):5059. doi: 10.1038/s41598-017-04998-7. Sci Rep. 2017. PMID: 28698645 Free PMC article.
-
Entropy Analysis for the Evaluation of Respiratory Changes Due to Asbestos Exposure and Associated Smoking.Entropy (Basel). 2019 Feb 27;21(3):225. doi: 10.3390/e21030225. Entropy (Basel). 2019. PMID: 33266939 Free PMC article.
-
A systematic review and meta-analysis of heart rate variability in COPD.Front Cardiovasc Med. 2023 Feb 17;10:1070327. doi: 10.3389/fcvm.2023.1070327. eCollection 2023. Front Cardiovasc Med. 2023. PMID: 36873414 Free PMC article.
-
Temporal variations in the pattern of breathing: techniques, sources, and applications to translational sciences.J Physiol Sci. 2022 Aug 29;72(1):22. doi: 10.1186/s12576-022-00847-z. J Physiol Sci. 2022. PMID: 36038825 Free PMC article. Review.
References
Publication types
MeSH terms
LinkOut - more resources
Full Text Sources
Other Literature Sources
Medical
