

Identification and reproducibility of diagnostic DNA markers for tuber starch and yield optimization in a novel association mapping population of potato (Solanum tuberosum L.)
- PMID: 26825382
- PMCID: PMC4799268
- DOI: 10.1007/s00122-016-2665-7
Identification and reproducibility of diagnostic DNA markers for tuber starch and yield optimization in a novel association mapping population of potato (Solanum tuberosum L.)
Abstract
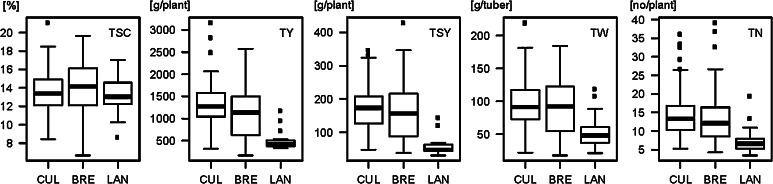
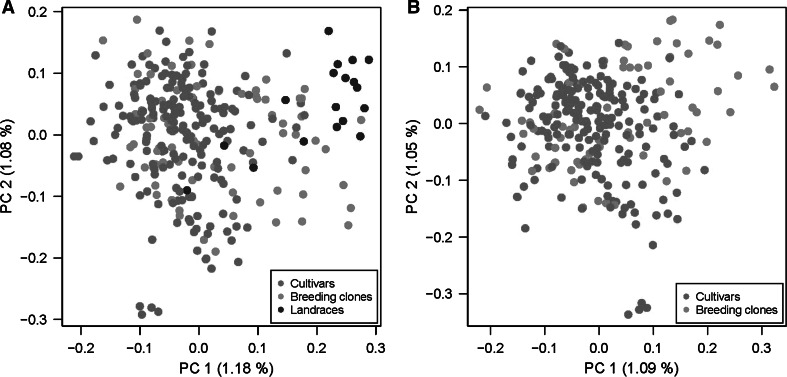
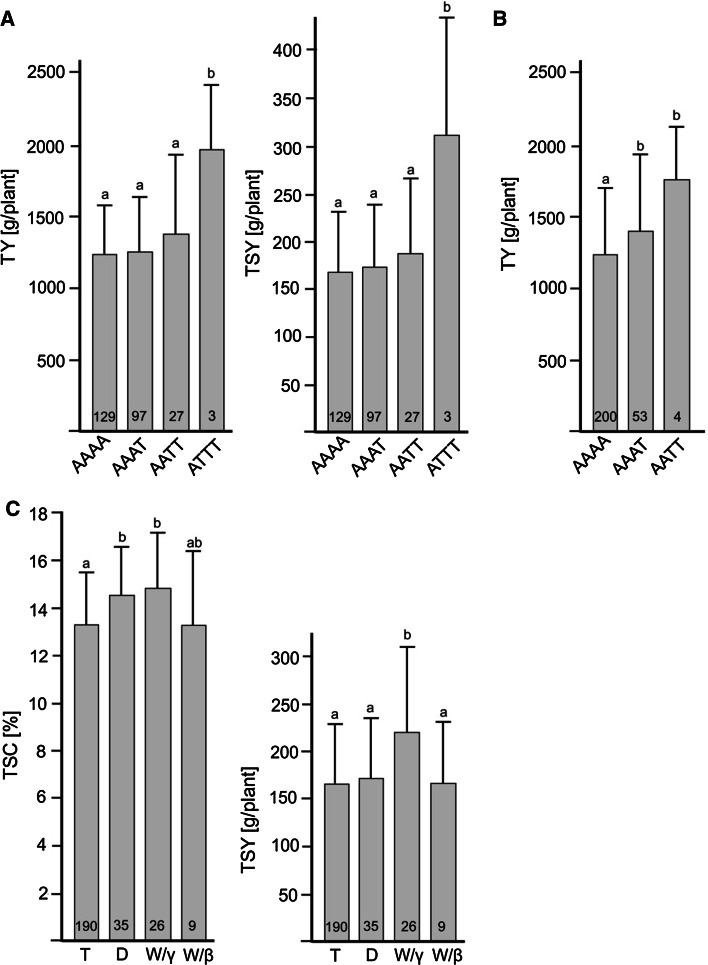
SNPs in candidate genes Pain - 1, InvCD141 (invertases), SSIV (starch synthase), StCDF1 (transcription factor), LapN (leucine aminopeptidase), and cytoplasm type are associated with potato tuber yield, starch content and/or starch yield. Tuber yield (TY), starch content (TSC), and starch yield (TSY) are complex characters of high importance for the potato crop in general and for industrial starch production in particular. DNA markers associated with superior alleles of genes that control the natural variation of TY, TSC, and TSY could increase precision and speed of breeding new cultivars optimized for potato starch production. Diagnostic DNA markers are identified by association mapping in populations of tetraploid potato varieties and advanced breeding clones. A novel association mapping population of 282 genotypes including varieties, breeding clones and Andean landraces was assembled and field evaluated in Northern Spain for TY, TSC, TSY, tuber number (TN) and tuber weight (TW). The landraces had lower mean values of TY, TW, TN, and TSY. The population was genotyped for 183 microsatellite alleles, 221 single nucleotide polymorphisms (SNPs) in fourteen candidate genes and eight known diagnostic markers for TSC and TSY. Association test statistics including kinship and population structure reproduced five known marker-trait associations of candidate genes and discovered new ones, particularly for tuber yield and starch yield. The inclusion of landraces increased the number of detected marker-trait associations. Integration of the present association mapping results with previous QTL linkage mapping studies for TY, TSC, TSY, TW, TN, and tuberization revealed some hot spots of QTL for these traits in the potato genome. The genomic positions of markers linked or associated with QTL for complex tuber traits suggest high multiplicity and genome wide distribution of the underlying genes.
Figures

Similar articles
-
Physical mapping of QTL for tuber yield, starch content and starch yield in tetraploid potato (Solanum tuberosum L.) by means of genome wide genotyping by sequencing and the 8.3 K SolCAP SNP array.BMC Genomics. 2017 Aug 22;18(1):642. doi: 10.1186/s12864-017-3979-9. BMC Genomics. 2017. PMID: 28830357 Free PMC article.
-
Validation of candidate gene markers for marker-assisted selection of potato cultivars with improved tuber quality.Theor Appl Genet. 2013 Apr;126(4):1039-52. doi: 10.1007/s00122-012-2035-z. Epub 2013 Jan 9. Theor Appl Genet. 2013. PMID: 23299900 Free PMC article.
-
Natural DNA variation at candidate loci is associated with potato chip color, tuber starch content, yield and starch yield.Theor Appl Genet. 2008 May;116(8):1167-81. doi: 10.1007/s00122-008-0746-y. Theor Appl Genet. 2008. PMID: 18379755 Free PMC article.
-
Bridging the gap between genome analysis and precision breeding in potato.Trends Genet. 2013 Apr;29(4):248-56. doi: 10.1016/j.tig.2012.11.006. Epub 2012 Dec 20. Trends Genet. 2013. PMID: 23261028 Review.
-
Organization of genes controlling disease resistance in the potato genome.Annu Rev Phytopathol. 2001;39:79-102. doi: 10.1146/annurev.phyto.39.1.79. Annu Rev Phytopathol. 2001. PMID: 11701860 Review.
Cited by
-
Unravelling Differences in Candidate Genes for Drought Tolerance in Potato (Solanum tuberosum L.) by Use of New Functional Microsatellite Markers.Genes (Basel). 2021 Mar 28;12(4):494. doi: 10.3390/genes12040494. Genes (Basel). 2021. PMID: 33800602 Free PMC article.
-
Metabolite profiling of tubers of an early- and a late-maturing potato line and their grafts.Metabolomics. 2022 Nov 5;18(11):88. doi: 10.1007/s11306-022-01950-3. Metabolomics. 2022. PMID: 36334159 Free PMC article.
-
Physical mapping of QTL for tuber yield, starch content and starch yield in tetraploid potato (Solanum tuberosum L.) by means of genome wide genotyping by sequencing and the 8.3 K SolCAP SNP array.BMC Genomics. 2017 Aug 22;18(1):642. doi: 10.1186/s12864-017-3979-9. BMC Genomics. 2017. PMID: 28830357 Free PMC article.
-
Genotyping-by-sequencing targets genic regions and improves resolution of genome-wide association studies in autotetraploid potato.Theor Appl Genet. 2024 Jul 9;137(8):180. doi: 10.1007/s00122-024-04651-8. Theor Appl Genet. 2024. PMID: 38980417 Free PMC article.
-
Pedigree-Based Deciphering of Genome-Wide Conserved Patterns in an Elite Potato Parental Line.Front Plant Sci. 2018 May 23;9:690. doi: 10.3389/fpls.2018.00690. eCollection 2018. Front Plant Sci. 2018. PMID: 29875792 Free PMC article.
References
-
- Chen X, Salamini F, Gebhardt C. A potato molecular-function map for carbohydrate metabolism and transport. Theor Appl Genet. 2001;102:284–295. doi: 10.1007/s001220051645. - DOI
Publication types
MeSH terms
Substances
LinkOut - more resources
Full Text Sources
Other Literature Sources
