. 2016 Sep;27(9):2733-47.
doi: 10.1681/ASN.2015101096. Epub 2016 Jan 29.

Dynamin-Related Protein 1 Deficiency Improves Mitochondrial Fitness and Protects against Progression of Diabetic Nephropathy

Affiliations

Dynamin-Related Protein 1 Deficiency Improves Mitochondrial Fitness and Protects against Progression of Diabetic Nephropathy

Bernard A Ayanga et al. J Am Soc Nephrol. 2016 Sep.

Abstract

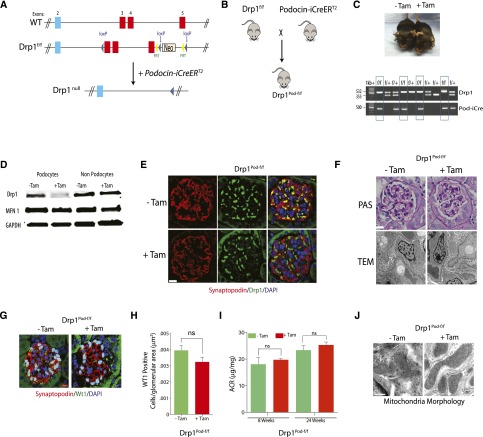
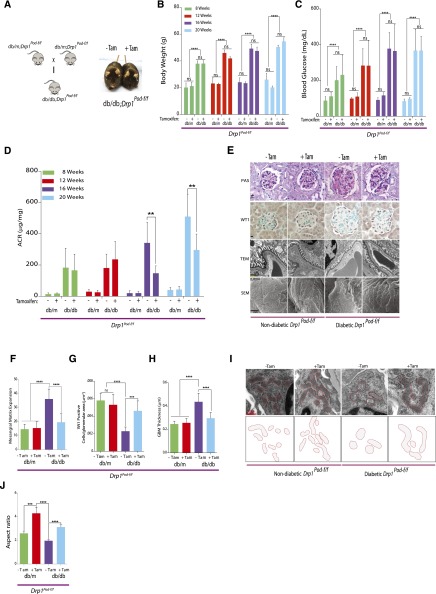
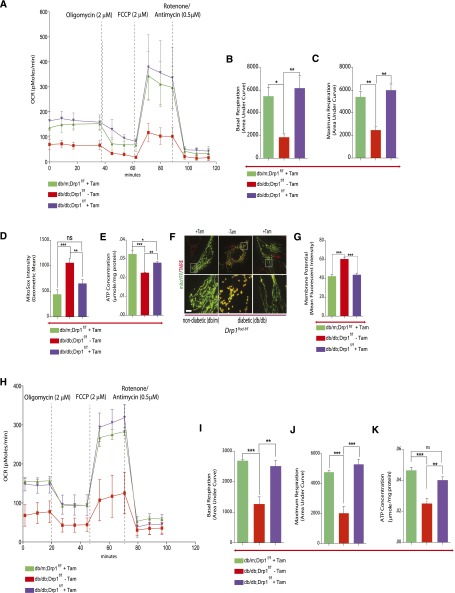
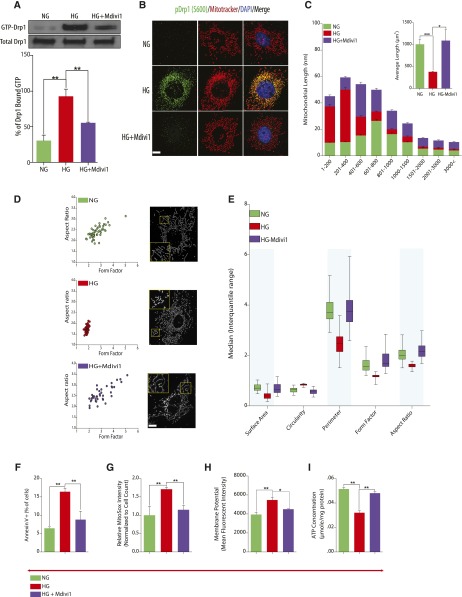
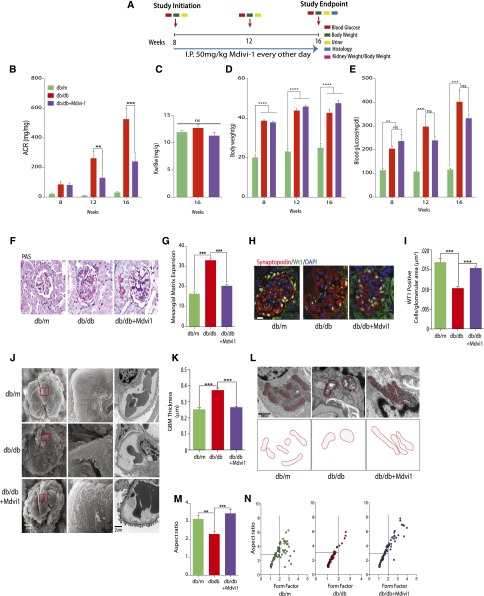
Mitochondrial fission has been linked to the pathogenesis of diabetic nephropathy (DN). However, how mitochondrial fission affects progression of DN in vivo is unknown. Here, we report the effect of conditional podocyte-specific deletion of dynamin-related protein 1 (Drp1), an essential component of mitochondrial fission, on the pathogenesis and progression of DN. Inducible podocyte-specific deletion of Drp1 in diabetic mice decreased albuminuria and improved mesangial matrix expansion and podocyte morphology. Ultrastructure analysis revealed a significant increase in fragmented mitochondria in the podocytes of wild-type diabetic mice but a marked improvement in mitochondrial structure in Drp1-null podocytes of diabetic mice. When isolated from diabetic mice and cultured in high glucose, Drp1-null podocytes had more elongated mitochondria and better mitochondrial fitness associated with enhanced oxygen consumption and ATP production than wild-type podocytes. Furthermore, administration of a pharmacologic inhibitor of Drp1, Mdivi1, significantly blunted mitochondrial fission and rescued key pathologic features of DN in mice. Taken together, these results provide novel correlations between mitochondrial morphology and the progression of DN and point to Drp1 as a potential therapeutic target in DN.

Keywords: diabetic nephropathy; mitochondria; podocyte.


Figures

Figure 1.
Figure 1.
Generation of inducible podocyte–specific Drp1 knockout mice. (A) Schematic of the Drp1 conditional knockout strategy. (B) Mating strategy to generate Drp1 conditional knockout in mouse podocytes. (C, upper panel) Representative images of tamoxifen–induced and noninduced control Drp1Pod-f/f mice. (C, lower panel) PCR genotyping confirming successful transmission of Pod-iCre and Drp1f/f homozygosity. (D) Western blot analysis confirming robust reduction in Drp1 expression in isolated podocytes from tamoxifen–induced and noninduced Drp1Pod-f/f mice (n=3 mice per group). GAPDH was used as loading control. (E) Representative immunofluorescence micrographs of kidney sections stained with primary antibodies against Drp1 (green) and Synaptopodin (red) from tamoxifen–induced Drp1Pod-f/f and noninduced mice (n=5 mice per group). Sections were counterstained with DAPI. Scale bars, 50μm. (F, upper panel) Representative light micrographs of kidney sections stained with PAS and (F, lower panel) representative transmission electron micrographs from tamoxifen–induced and noninduced Drp1Pod-f/f mice (n=5 mice per group). Scale bars, 10μm in F, upper panel; 500nm in F, lower panel. (G) Representative immunofluorescence micrographs of kidney sections stained with primary antibodies against WT1 from tamoxifen–induced and noninduced Drp1Pod-f/f mice. Scale bars, 10 μm. (H) Quantification of sections stained with WT1 from G. Results are generated from 25 randomly selected kidney glomeruli per animal in each group (n=5 mice per group). (I) Albumin-to-creatinine ratio (ACR) was measured in mice 8 and 24 weeks after tamoxifen induction. (J) Representative TEM micrographs of mitochondria in podocytes from tamoxifen–induced and noninduced Drp1Pod-f/f mice (n=5 mice per group).Results are presented as means±SEMs. Scale bars, 2 μm.
Figure 2.
Figure 2.
Conditional deletion of Drp1 in podocytes protects against progression of DN. (A, left panel) Mating strategy to generate Drp1 conditional knockout in mouse podocytes of diabetic mice. (A, right panel) Representative image of tamoxifen–induced and noninduced diabetic db/db;Drp1Pod-f/f mice. (B) Body weight, (C)blood glucose levels, and (D) albumin-to-creatinine ratios (ACRs; micrograms per milligram) of tamoxifen-induced and noninduced controls from nondiabetic (db/m;Drp1Pod-f/f) and diabetic (db/db;Drp1Pod-f/f)mice at 4-week intervals beginning at 8 weeks of age (n=10 mice per group).(E) Representative micrographs of PAS–stained kidney sections (row 1), WT1 (row 2), transmission electron micrographs (row 3), and scanning electron micrographs (row 4) from the groups described in D. Scale bars, 10μm for rows 1 and 2; 500nm for row 3; 2 μm in row 4. (F) Quantification of mesangial matrix expansion (n=10 per group) and (G) WT1-positive glomeruli from 25 randomly selected glomeruli per animal in each indicated group (n=5 mice per group). (H) Quantification of GBM thickness (n=5–7 mice per group). (I, upper panel) Representative TEM micrographs of podocyte mitochondria from groups described in D. (I, lower panel) Tracing of mitochondria from aforementioned TEM micrographs. (J) Average aspect ratios in each group. Results are presented as means±SEMs. **P<0.01; ***P<0.01; ****P<0.001.
Figure 3.
Figure 3.
Interruption of mitochondrial fission improves mitochondria fitness. (A) Bioenergetics profile as measured by OCR with a Seahorse ×24 Extracellular Flux Analyzer (Seahorse Bioscience) in podocytes in each group (n=3 per group). Oligomycin (2 μM), FCCP (2 μM), and rotenone (0.5 μM)/antimycin A (0.5 μM) were added at the times indicated. (B) Basal and (C) maximal respiratory rates of podocytes were determined by calculating the area under the curve. Values are means±SEMs of two to three replicates of two separate experiments. (D) Mitochondrial ROS were described as relative mean fluorescence intensity of MitoSox Red–positive cells. (E) ATP levels were quantified in podocytes isolated from db/m;Drp1Pod-f/, db/db;Drp1Pod-f/f, and noninduced db/db;Drp1Pod-f/f control mice (n=3 per group). (F) Mito-YFP Green (mitochondria) and TMRE were used to examine mitochondrial membrane potential in podocytes. All images are merged projections of 543-nm and 488-nm Z-serial channels. (G) The fluorescent density of TMRE was used for quantitative analysis. (H) OCR analysis for podocytes freshly isolated from mice. (I) Basal and (J) maximum respiration rates as measured by calculating the area under the curve for the indicated segments. (K) ATP levels in permeabilized mouse podocytes freshly isolated from each group. Results are presented as means±SEMs. *P<0.05; **P<0.01; ***P<0.01.
Figure 4.
Figure 4.
Pharmacologic inhibition of Drp1 attenuates HG–induced mitochondrial dysfunction. (A, upper panel) Western blot analysis of GTP-bound Drp1 in mouse podocytes cultured in NG or HG and HG-cultured cells treated with 20μm Mdivi1. (A, lower panel) Densitometric analysis of data from A, upper panel. Values were normalized to total Drp1 levels, which remained unchanged. (B) Representative immunofluorescence micrographs of cells cultured as in A and stained with MitoTracker Red (red) and primary antibodies directed against phosphorylated Drp1 at Ser-637 (green). Nuclei were counterstained with DAPI (blue). Scale bars, 10 μm. (C) Data showing mitochondrial length measurement by ImageJ analysis. The morphology of ≥50 podocytes was determined for each condition. (D) Images of mitochondrial morphology visualized by MitoTracker Red staining of podocytes grown in NG, HG, or HG treated with Mdivi1. (E) Form factor, circularity, perimeter, surface area, and aspect ratios were quantified for each condition. Mitochondrial morphology of ≥120 mitochondria was determined for each condition and assessed by ImageJ analysis. (F) Quantitative data expressing percentage of Annexin VFITC–positive cells. (G) Mitochondrial ROS measurements described as relative mean fluorescence intensity of MitoSox Red–positive cells. (H) Quantification of mitochondrial membrane potential as measured by TMRE staining and flow cytometry analysis. (I) ATP levels were quantified in mouse podocytes cultured in NG or HG and HG-cultured cells treated with 20μm Mdivi1 (n=3 in triplicates). Results are presented as means±SEMs.*P<0.05; **P<0.01; ***P<0.01.
Figure 5.
Figure 5.
Mdivi1 prevents progression of DN. (A) Schematic describing Mdivi1 administration protocol. (B) Albumin-to-creatinine ratios (ACRs; micrograms per milligram) of db/m (n=5), db/db (n=6), and db/db mice administered Mdivi1 (n=8) at 8, 12, and 16 weeks of age. (C) Kidney weight-to-body weight ratio, (D) body weight, and (E) blood glucose levels at each time point for the groups described in B. (F) Representative light micrographs of PAS staining of kidney sections from db/m, db/db, and db/db mice administered Mdivi1 (n=5–10 mice per group). Scale bars, 10μm. (G) Quantification of mesangial matrix expansion (n=5–7 mice per group). (H) Representative immunofluorescence micrographs of kidney sections from indicated groups. Sections were probed with primary antibodies directed against WT1 (green) and Synaptopodin (red). Nuclei were counterstained with DAPI (blue), Scale bars, 10 μm. (I) Quantification of sections stained with WT1 from H. Results are generated from 50 randomly selected kidney glomeruli per animal in each group (n=5–7 mice per group). (J) Representative TEM and scanning electron microscopy micrographs of kidneys glomeruli from the groups described in B. Scale bars, 2 μm. (K) Quantification of GBM thickness (n=5–7 mice per group). (L, upper panel) Representative TEM micrographs of podocyte mitochondria from glomeruli of each group. (L, lower panel) Tracing of mitochondria from TEM micrographs. (M) Average aspect ratio for each group from B (n=5–7 mice per group). (N) Quantification of podocyte mitochondrial aspect ratio plotted against form factor from TEM micrographs of the groups from B (n=5–7 mice per group). Results are presented as means±SEMs. **P<0.01; ***P<0.01; ****P<0.001.

Similar articles

Cited by

References

    1. Youle RJ, van der Bliek AM: Mitochondrial fission, fusion, and stress. Science 337: 1062–1065, 2012 - PMC - PubMed
    1. Westermann B: Mitochondrial fusion and fission in cell life and death. Nat Rev Mol Cell Biol 11: 872–884, 2010 - PubMed
    1. Osman C, Noriega TR, Okreglak V, Fung JC, Walter P: Integrity of the yeast mitochondrial genome, but not its distribution and inheritance, relies on mitochondrial fission and fusion. Proc Natl Acad Sci U S A 112: E947–E956, 2015 - PMC - PubMed
    1. Nunnari J, Suomalainen A: Mitochondria: In sickness and in health. Cell 148: 1145–1159, 2012 - PMC - PubMed
    1. Hoppins S, Nunnari J: Cell biology. Mitochondrial dynamics and apoptosis--the ER connection. Science 337: 1052–1054, 2012 - PubMed

Publication types