. 2016 Apr 15;291(16):8440-52.
doi: 10.1074/jbc.M115.713008. Epub 2016 Jan 29.

T Cell Receptor-induced Nuclear Factor κB (NF-κB) Signaling and Transcriptional Activation Are Regulated by STIM1- and Orai1-mediated Calcium Entry

Affiliations

T Cell Receptor-induced Nuclear Factor κB (NF-κB) Signaling and Transcriptional Activation Are Regulated by STIM1- and Orai1-mediated Calcium Entry

Xiaohong Liu et al. J Biol Chem. .

Abstract

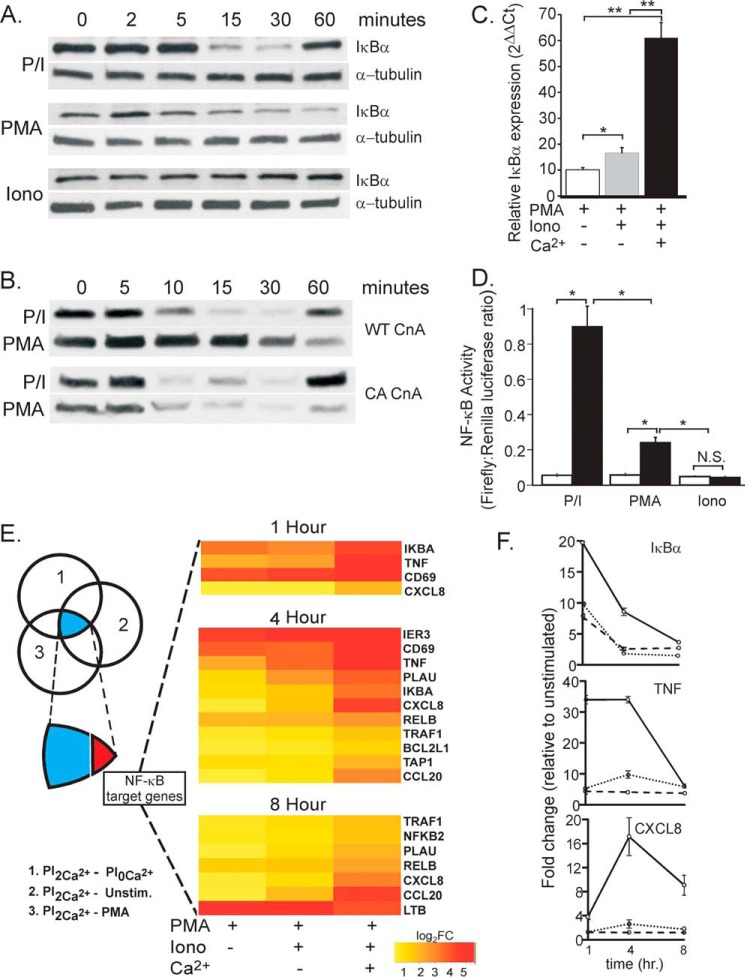
T cell activation following antigen binding to the T cell receptor (TCR) involves the mobilization of intracellular Ca(2+) to activate the key transcription factors nuclear factor of activated T lymphocytes (NFAT) and NF-κB. The mechanism of NFAT activation by Ca(2+) has been determined. However, the role of Ca(2+) in controlling NF-κB signaling is poorly understood, and the source of Ca(2+) required for NF-κB activation is unknown. We demonstrate that TCR- but not TNF-induced NF-κB signaling upstream of IκB kinase activation absolutely requires the influx of extracellular Ca(2+) via STIM1-dependent Ca(2+) release-activated Ca(2+)/Orai channels. We further show that Ca(2+) influx controls phosphorylation of the NF-κB protein p65 on Ser-536 and that this posttranslational modification controls its nuclear localization and transcriptional activation. Notably, our data reveal that this role for Ca(2+) is entirely separate from its upstream control of IκBα degradation, thereby identifying a novel Ca(2+)-dependent distal step in TCR-induced NF-κB activation. Finally, we demonstrate that this control of distal signaling occurs via Ca(2+)-dependent PKCα-mediated phosphorylation of p65. Thus, we establish the source of Ca(2+) required for TCR-induced NF-κB activation and define a new distal Ca(2+)-dependent checkpoint in TCR-induced NF-κB signaling that has broad implications for the control of immune cell development and T cell functional specificity.

Keywords: NF-κB transcription factor; PKC; T-cell receptor (TCR); calcium; calcium release-activated calcium channel protein 1 (ORAI1); posttranslational modification (PTM); stromal interaction molecule 1 (STIM1).


Figures

FIGURE 1.
FIGURE 1.
Extracellular Ca2+ regulates TCR- but not TNF-induced classical NF-κB activation in human T lymphocytes. A, Jurkat T cells loaded with Fura-2/AM were initially bathed in Ca2+-free medium and stimulated with PMA (200 nm) and ionomycin (1 μm) (left panel), anti-CD3/CD28 (center panel), or TNF (10 ng/ml, right panel) to assess release from intracellular (ER) stores. Subsequent perfusion with Ca2+-containing (2 mm) medium was performed to assess the extent of Orai activation. B, Jurkat T cells bathed in Ca2+-containing (2 mm) (top panels) or Ca2+ free (0 mm Ca2+, bottom panels) medium were activated by cross-linking CD3 and CD28 with P/I or TNF (10 ng/ml) for the times indicated, and IκBα levels were determined by immunoblotting. C, NF-κB transcriptional activity was measured under identical conditions as the immunoblot analyses in B in Jurkat T cells expressing an NF-κB firefly luciferase reporter. Firefly luciferase activity is expressed relative to a Renilla luciferase control before (0 h) and after (4 h) stimulation with anti-CD3/28 (left), P/I (center), or TNF (right) in the presence (+) or absence (−) of extracellular Ca2+. Mean firefly/Renilla luciferase ratios ± S.E. from three independent experiments (4 replicates/experiment) are displayed, and statistical significance was evaluated using Welch's t test. ***, p < 0.001; N.S., not significant. D, primary human CD4+ T cells were stimulated in Ca2+-replete (0.4 mm) or Ca2+-free (0 mm) medium, and then IκBα levels were determined by immunoblotting. Blots were probed with anti-α-tubulin as a loading control.
FIGURE 2.
FIGURE 2.
STIM1-dependent Ca2+ entry is required for TCR- but not TNF-induced NF-κB activation. A, immunoblot analysis of STIM1 and α-tubulin levels in Jurkat T cells transfected with either vector alone, shSTIM1, or shSTIM1-STIM1 suppression and rescue vectors. **, p < 0.01; n = 4 experiments. B, the role of STIM1 in P/I- and 3/28-mediated Ca2+ entry was similarly assessed in control (vector-transfected) Jurkat T cells, STIM1-suppressed cells, and STIM1 suppression with STIM1 rescue as described in A. Each trace represents the average response of at least 30 cells and is representative of at least three separate experiments. C, Jurkat T cells were transfected with control vector (left panel), shSTIM1 (center panel), or shSTIM1-STIM1 (right panel) and then incubated for the times indicated with 3/28, P/I, or TNF. Lysates were immunoblotted with either anti-IκBα or α-tubulin loading control. D, Jurkat T cells were transfected with the NF-κB luciferase reporter construct together with either vector alone, shSTIM1, or shSTIM1-STIM1 and then activated with 3/28, P/I, or TNF for 4 h. Mean firefly:Renilla luciferase ratios ± S.E. pooled from at least three independent experiments (3 replicates/experiment) are shown and were compared using Welch's t test. *, p < 0.05; **, p < 0.01; ***, p < 0.001; N.S., not significant.
FIGURE 3.
FIGURE 3.
Orai1-mediated Ca2+ entry is required for TCR- but not TNF-induced NF-κB activation. A, Jurkat T cells were incubated with (bottom panel) and without (top panel) Synta66 (50 μm) and then activated with thapsigargin (1 μm) under Ca2+-free (0 mm) and Ca2+-replete (2 mm) conditions. B, Jurkat T cells were either untreated (−) or incubated for 15 min (+) with Synta66 and then stimulated with anti-CD3/28 or TNF for the times indicated. Time-dependent changes in IκBα were determined by immunoblotting, and anti-α-tubulin was used as a loading control. C, Ca2+ traces in Jurkat T cells stably overexpressing the dominant negative E106A Orai1 that were stimulated with P/I, 3/28, or TNF as shown. D, Jurkat T cells stably overexpressing either wild-type Orai (Orai-cyan fluorescent protein, Orai-CFP) or the dominant negative Orai1-E106A were stimulated with 3/28, P/I, or TNF for the times indicated, and immunoblot analysis was performed to quantify IκBα and α-tubulin.
FIGURE 4.
FIGURE 4.
PKC activation is sufficient for IκBα degradation, but Ca2+ is required for NF-κB transcriptional activation. A, Jurkat T cells were stimulated as indicated with P/I, PMA alone, or ionomycin (Iono) alone, and IκBα and α-tubulin levels were measured by immunoblotting. B, Jurkat T cells stably expressing either WT CnA or constitutively active (CA) CnA were stimulated as indicated with P/I or PMA alone, and IκBα and α-tubulin levels were detected by immunoblotting. C, Jurkat T cells were stimulated with PMA or P/I in the absence and presence of extracellular Ca2+ for 60 min, and IκBα mRNA was quantified by quantitative RT-PCR. IκBα Ct values were subtracted from β-actin and compared between stimulated and unstimulated samples using Welch's t test. *, p < 0.05; **, p < 0.01. D, NF-κB transcriptional activity in Jurkat T cells expressing the NF-κB luciferase reporter stimulated 4 h with P/I, PMA alone, or ionomycin alone (mean firefly:Renilla luciferase ratios ± S.E. of three independent experiments (4 replicates/experiment) were compared using Welch's t test. *, p < 0.05; N.S., not significant. E, microarray analysis of gene expression at 1, 4, and 8 h from PMA, P/I in 2 mm Ca2+ (PI2Ca2+)-treated, P/I in 0 mm Ca2+ (PI0Ca2+)-treated, and unstimulated (Unstim, 1 h) cells. Genes differentially expressed (log2 -fold change (FC), >0.59; false detection rate, <0.05) between PI2Ca2+ and PI2Ca2+ (1), PI2Ca2+ and unstimulated cells (2), and PI2Ca2+ and PMA (3) were identified (blue), and, for each time point, the log2 -fold change in expression of validated NF-κB target genes (red) is listed relative to levels in unstimulated cells. F, time course of IκBα (top panel), TNF (center panel), and CXCL8 (bottom panel) mRNA expression (-fold change) from the same microarray following stimulation with PMA alone (dotted lines), P/I in 0 mm Ca2+ (dashed lines), and P/I in 2 mm Ca2+ (solid lines).
FIGURE 5.
FIGURE 5.
Ca2+ controls TCR-induced p65 nuclear localization. A, Jurkat cells were stimulated with PMA, ionomycin (Iono), or both for 15, 30, or 60 min, and then nuclear localization of p65 was determined by confocal imaging. B, the data are presented as a mean ± S.E. ratio of nuclear:cytoplasmic p65 from three independent experiments and were compared using Student's t test. *, p < 0.05; **, p < 0.01. C, Jurkat T cells were stimulated as in A for 30 min in the absence or presence of extracellular Ca2+, and p65 localization was determined by confocal imaging. D, the ratio of nuclear:cytoplasmic p65 was determined from three independent experiments, are presented as the mean ± S.E. ratio of nuclear:cytoplasmic p65, and were compared using Student's t test. *, p < 0.05; **, p < 0.01.
FIGURE 6.
FIGURE 6.
Ca2+ controls the phosphorylation of p65 at Ser536. A, Jurkat T cells were stimulated with P/I, PMA alone, or ionomycin (Iono) alone for the times shown, and then lysates were immunoblotted to determine the amounts of total p65 and Ser-536 phosphorylation. B, cells were treated with P/I in the absence or presence of 2 mm Ca2+, and then p65 or Ser(P)-536 amounts were determined by immunoblotting. C, Jurkat cells were incubated with TNF for the times shown in either Ca2+-containing or Ca2+-free extracellular bath solution, and then lysates were prepared and immunoblotted using the antibodies indicated. D, WT p65-GFP, and p65-GFP with serine 536-to-alanine (S536A) and serine 536-to-aspartate (S536D) point mutations were expressed in Jurkat T cells to determine the role of Ser-536 phosphorylation in p65 nuclear localization. WT and mutant p65-GFP localization was visualized over a time course of 60 min in live cells by spinning disk confocal microscopy. In each instance, cells were first stimulated for 30 min with PMA alone to trigger IκBα degradation and then were treated in the continued presence of PMA with ionomycin after 30 min to assess the role of Ca2+ in p65 nuclear localization. E, Jurkat cells were treated for the times indicated with either P/I (left panel) or PMA alone, followed by addition of ionomycin after 30 min (right panel), and then the amounts of IκBα were determined by immunoblotting.
FIGURE 7.
FIGURE 7.
PKCα mediates Ca2+-dependent but not TNF-induced p65 nuclear localization and promotor binding. A, PKCα levels were suppressed >90% 48 h after transfection of Jurkat T cells with a PKCα suppression construct as measured by immunoblot analysis. The densitometry plot represents the mean ± S.E. from five independent experiments. B, Jurkat cells transfected with either vector alone (Control) or shPKCα were stimulated with either P/I or TNF for the times shown. Lysates were prepared, and IκBα or α-tubulin was measured by immunoblot analysis. A representative example of four separate experiments is shown. C, cells were treated as described in B, and then p65 and Ser(P)-536 levels were quantified by immunoblot analysis. D, densitometric analysis of Ser-536 phosphorylation relative to the total p65 amount. Each value represents the mean ± S.E. of normalized values from four independent experiments. **, p < 0.01; Welch's t test. E, Jurkat cells were stimulated for the indicated time with PMA and ionomycin, and p65 nuclear and cytoplasmic localization in control and PKCα-suppressed cells was analyzed by confocal microscopy. The distribution of nuclear:cytoplasmic ratios is plotted for the indicated time points (the example is representative of three separate experiments). F, box plot of the p65 nuclear to cytoplasmic ratio. Wilcoxon rank-sum test revealed significant inhibition of p65 nuclear localization at each time point after stimulation. G, chromatin immunoprecipitation analysis of p65 promotor binding in cells stimulated for 60 min with PMA and ionomycin. IκBα, TNF, and CXCL8 abundance relative to chromatin input was compared between WT and PKCα-suppressed cells. Promoter binding (mean ± S.D.) relative to chromatin input is shown for IgG (control) and p65 immunoprecipitates (representative of three independent experiments. **, p < 0.01, Welch's t test.

Similar articles

Cited by

References

    1. Lewis R. S. (2003) Calcium oscillations in T-cells: mechanisms and consequences for gene expression. Biochem. Soc. Trans. 31, 925–929 - PubMed
    1. Healy J. I., Dolmetsch R. E., Lewis R. S., and Goodnow C. C. (1998) Quantitative and qualitative control of antigen receptor signalling in tolerant B lymphocytes. Novartis Found. Symp. 215, 137–144, discussion 144–145, 186–190 - PubMed
    1. Dolmetsch R. E., Lewis R. S., Goodnow C. C., and Healy J. I. (1997) Differential activation of transcription factors induced by Ca2+ response amplitude and duration. Nature 386, 855–858 - PubMed
    1. Healy J. I., Dolmetsch R. E., Timmerman L. A., Cyster J. G., Thomas M. L., Crabtree G. R., Lewis R. S., and Goodnow C. C. (1997) Different nuclear signals are activated by the B cell receptor during positive versus negative signaling. Immunity 6, 419–428 - PubMed
    1. Dolmetsch R. E., Xu K., and Lewis R. S. (1998) Calcium oscillations increase the efficiency and specificity of gene expression. Nature 392, 933–936 - PubMed

Publication types

MeSH terms