

Evolution of genetic instability in heterogeneous tumors
- PMID: 26826489
- PMCID: PMC5680090
- DOI: 10.1016/j.jtbi.2015.11.028
Evolution of genetic instability in heterogeneous tumors
Abstract
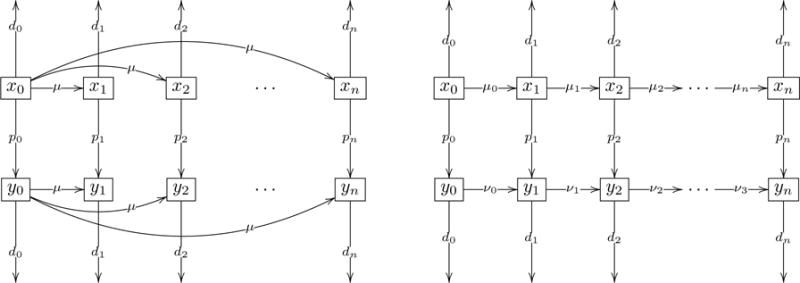
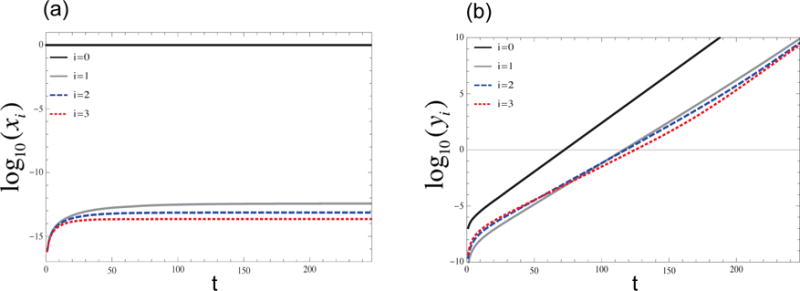
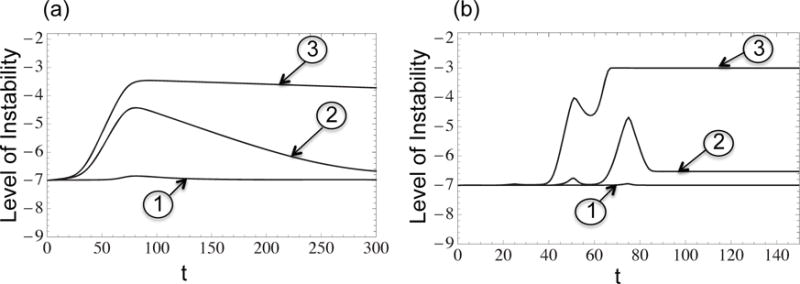
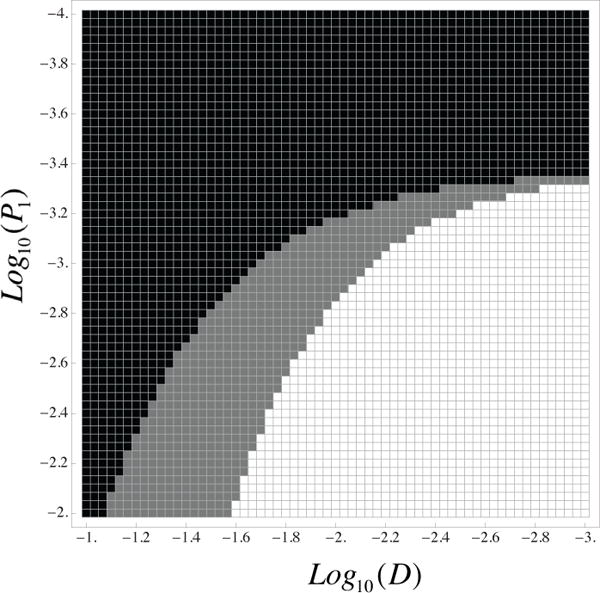
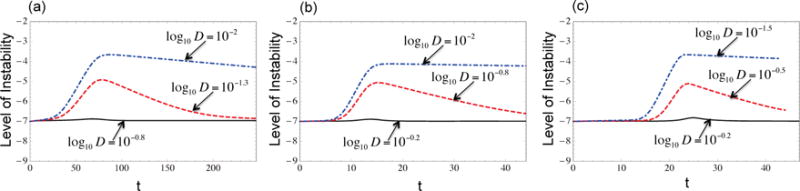
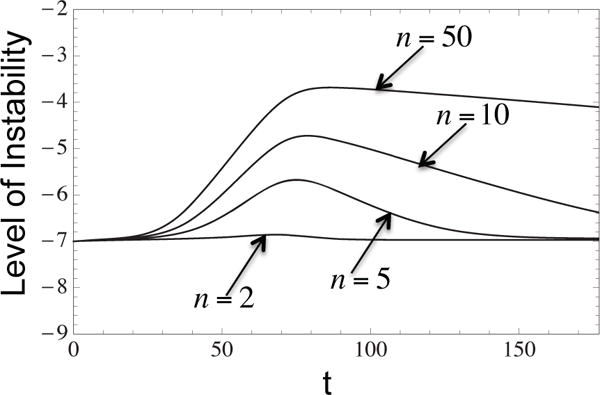
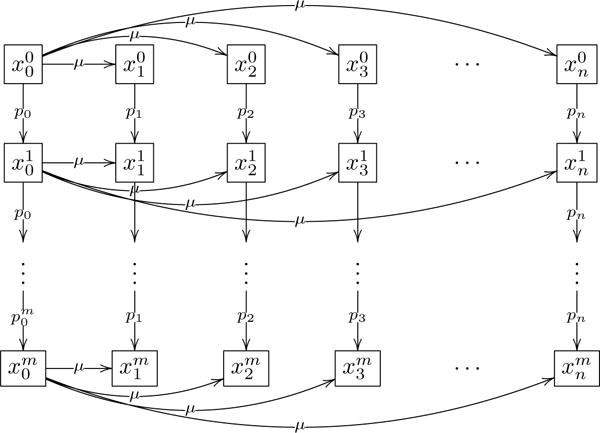
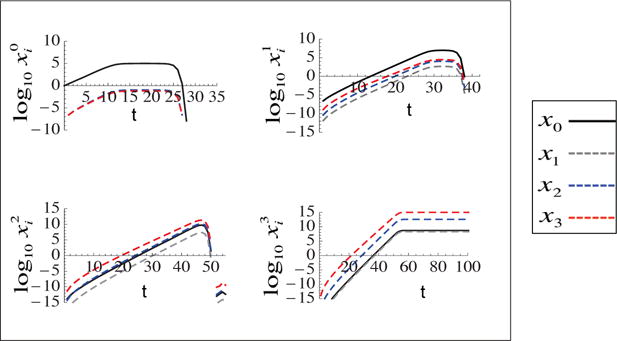
Genetic instability is an important characteristic of cancer. While most cancers develop genetic instability at some stage of their progression, sometimes a temporary rise of instability is followed by the return to a relatively stable genome. Neither the reasons for these dynamics, nor, more generally, the role of instability in tumor progression, are well understood. In this paper we develop a class of mathematical models to study the evolutionary competition dynamics among different sub-populations in a heterogeneous tumor. We observe that despite the complexity of this multi-component and multi-process system, there is only a small number of scenarios expected in the context of the evolution of instability. If the penalty incurred by unstable cells (the decrease in the growth due to deleterious mutations) is high compared with the gain (the production rate of advantageous mutations), then instability does not evolve. In the opposite case, instability evolves and comes to dominate the system. In the intermediate parameter regime, instability is generated but later gives way to stable clones. Moreover, the model also informs us of the patterns of instability for cancer lineages corresponding to different stages of progression. It is predicted that mutations causing instability are merely "passengers" in tumors that have undergone only a small number of malignant mutations. Further down the path of carcinogenesis, however, unstable cells are more likely to give rise to the winning clonal wave that takes over the tumor and carries the evolution forward, thus conferring a causal role of the instability in such cases. Further, each individual clonal wave (i.e. cells harboring a fixed number of malignant driver mutations) experiences its own evolutionary history. It can fall under one of three types of temporal behavior: stable throughout, unstable to stable, or unstable throughout. Which scenario is realized depends on the subtle (but predictable) interplay among mutation rates and the death toll associated with the instability. The modeling approach provided here sheds light onto important aspects of the evolutionary dynamics of instability, which may be relevant to treatment scenarios that target instability or damage repair.
Keywords: Chromosomal instability; Driver mutation; Microsatellite instability; Passenger mutation.
Copyright © 2015 Elsevier Ltd. All rights reserved.
Figures
Similar articles
-
Modelling the evolution of genetic instability during tumour progression.Evol Appl. 2013 Jan;6(1):20-33. doi: 10.1111/eva.12024. Epub 2012 Nov 26. Evol Appl. 2013. PMID: 23396531 Free PMC article.
-
Evolutionary dynamics of mutator phenotypes in cancer: implications for chemotherapy.Cancer Res. 2003 Oct 15;63(20):6635-42. Cancer Res. 2003. PMID: 14583456
-
Aneuploidy, the primary cause of the multilateral genomic instability of neoplastic and preneoplastic cells.IUBMB Life. 2004 Feb;56(2):65-81. doi: 10.1080/15216540410001667902. IUBMB Life. 2004. PMID: 15085930 Review.
-
Pan-cancer inference of intra-tumor heterogeneity reveals associations with different forms of genomic instability.PLoS Genet. 2018 Sep 13;14(9):e1007669. doi: 10.1371/journal.pgen.1007669. eCollection 2018 Sep. PLoS Genet. 2018. PMID: 30212491 Free PMC article.
-
Cancer heterogeneity: converting a limitation into a source of biologic information.J Transl Med. 2017 Sep 8;15(1):190. doi: 10.1186/s12967-017-1290-9. J Transl Med. 2017. PMID: 28886708 Free PMC article. Review.
Cited by
-
Clonal cooperativity in heterogenous cancers.Semin Cell Dev Biol. 2017 Apr;64:79-89. doi: 10.1016/j.semcdb.2016.08.028. Epub 2016 Aug 28. Semin Cell Dev Biol. 2017. PMID: 27582427 Free PMC article. Review.
-
Tumor heterogeneity in muscle-invasive bladder cancer.Transl Androl Urol. 2020 Dec;9(6):2866-2880. doi: 10.21037/tau.2020.03.13. Transl Androl Urol. 2020. PMID: 33457261 Free PMC article. Review.
-
DNA Damage Repair and Current Therapeutic Approaches in Gastric Cancer: A Comprehensive Review.Front Genet. 2022 Aug 12;13:931866. doi: 10.3389/fgene.2022.931866. eCollection 2022. Front Genet. 2022. PMID: 36035159 Free PMC article. Review.
-
Correlations between Risk Factors for Breast Cancer and Genetic Instability in Cancer Patients-A Clinical Perspective Study.Front Genet. 2018 Feb 16;8:236. doi: 10.3389/fgene.2017.00236. eCollection 2017. Front Genet. 2018. PMID: 29503660 Free PMC article.
-
Adaptive dynamics of unstable cancer populations: The canonical equation.Evol Appl. 2018 Apr 17;11(8):1283-1292. doi: 10.1111/eva.12625. eCollection 2018 Sep. Evol Appl. 2018. PMID: 30151040 Free PMC article.
References
-
- Almendro V, Marusyk A, Polyak K. Cellular heterogeneity and molecular evolution in cancer. Annual Review of Pathology: Mechanisms of Disease. 2013;8:277–302. - PubMed
-
- Artandi SE, DePinho RA. A critical role for telomeres in suppressing and facilitating carcinogenesis. Current opinion in genetics & development. 2000;10(1):39–46. - PubMed
-
- Begg AC, Stewart FA, Vens C. Strategies to improve radiotherapy with targeted drugs. Nature Reviews Cancer. 2011;11(4):239–253. - PubMed
Publication types
MeSH terms
Grants and funding
LinkOut - more resources
Full Text Sources
Other Literature Sources
