

Evidence for maternal control of seed size in maize from phenotypic and transcriptional analysis
- PMID: 26826570
- PMCID: PMC4783370
- DOI: 10.1093/jxb/erw006
Evidence for maternal control of seed size in maize from phenotypic and transcriptional analysis
Abstract
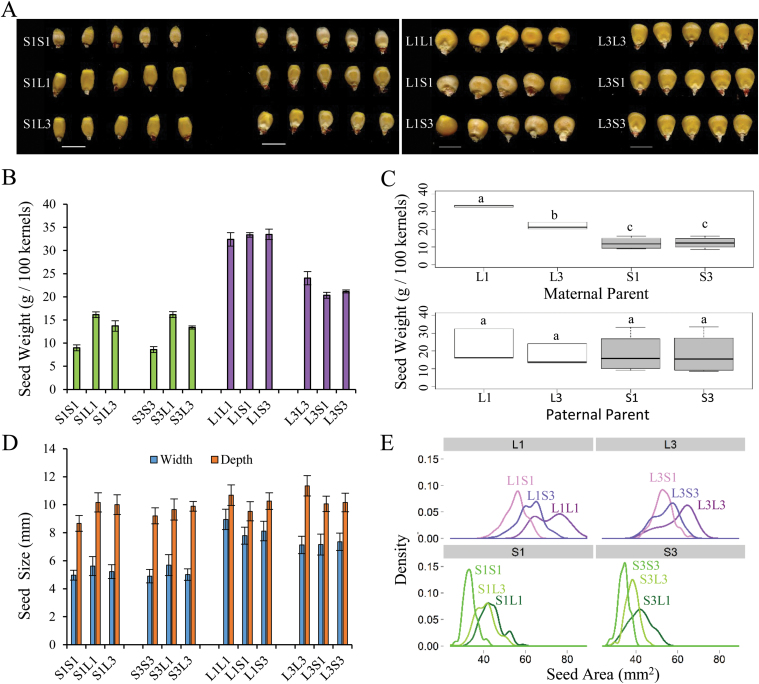
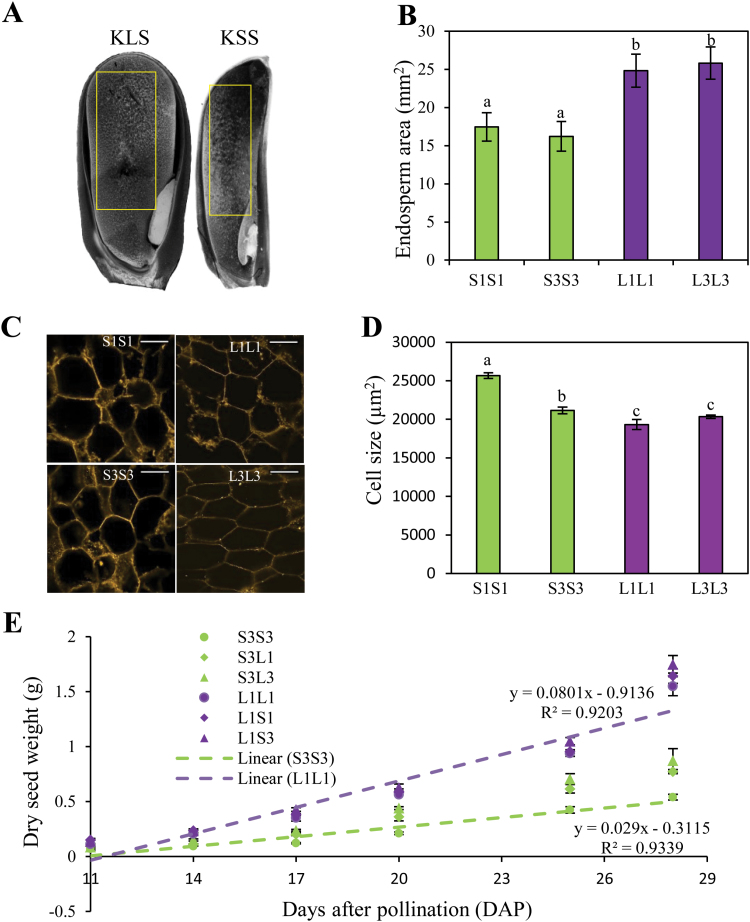
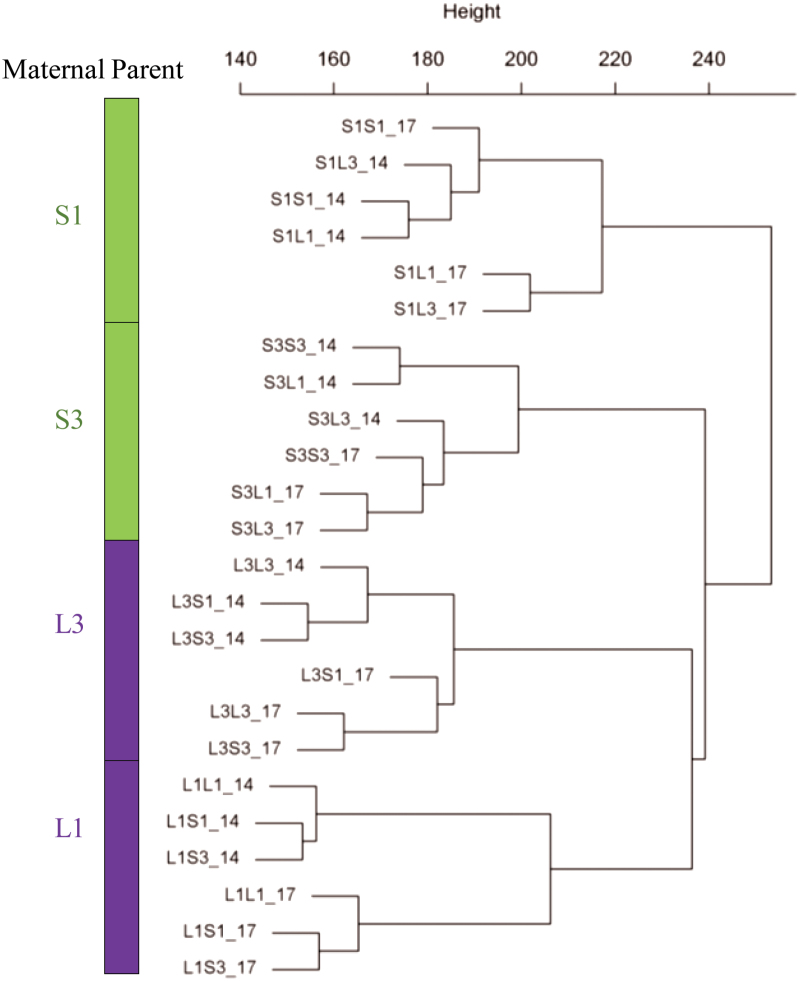
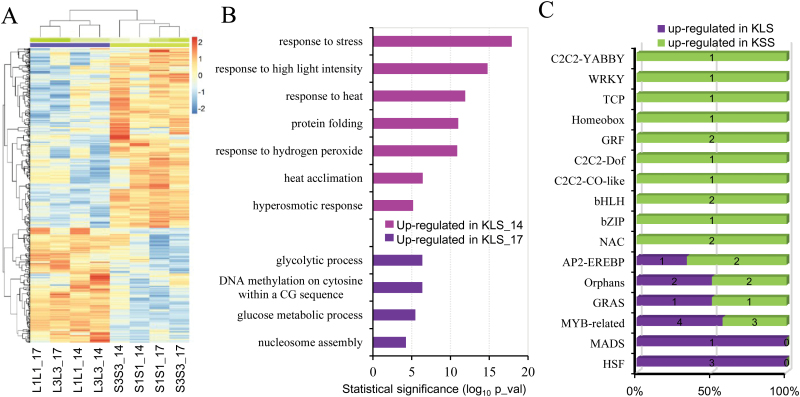
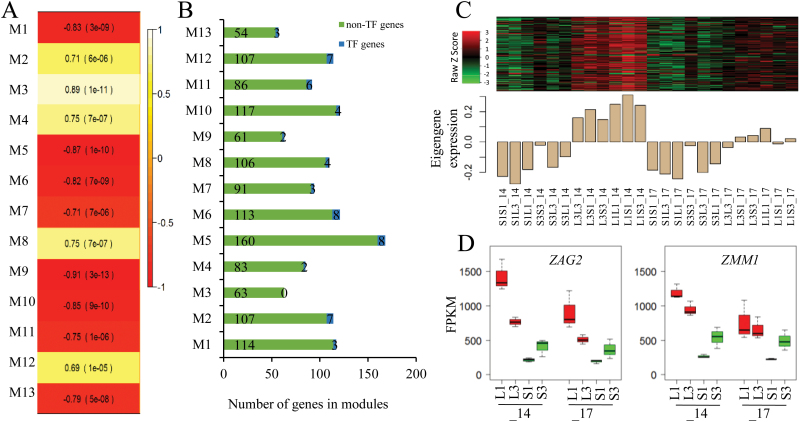
Seed size is an important component of grain yield and a key determinant trait for crop domestication. The Krug Yellow Dent long-term selection experiment for large and small seed provides a valuable resource to dissect genetic and phenotypic changes affecting seed size within a common genetic background. In this study, inbred lines derived from Krug Large Seed (KLS) and Krug Small Seed (KSS) populations and reciprocal F1 crosses were used to investigate developmental and molecular mechanisms governing seed size. Seed morphological characteristics showed striking differences between KLS and KSS inbred lines, and the reciprocal cross experiment revealed a strong maternal influence on both seed weight and seed size. Quantification of endosperm area, starchy endosperm cell size, and kernel dry mass accumulation indicated a positive correlation between seed size, endosperm cell number, and grain filling rate, and patterns of grain filling in reciprocal crosses mirrored that of the maternal parent. Consistent with the maternal contribution to seed weight, transcriptome profiling of reciprocal F1 hybrids showed substantial similarities to the maternal parent. A set of differentially expressed genes between KLS and KSS inbreds were found, which fell into a broad number of functional categories including DNA methylation, nucleosome assembly, and heat stress response. In addition, gene co-expression network analysis of parental inbreds and reciprocal F1 hybrids identified co-expression modules enriched in ovule development and DNA methylation, implicating these two processes in seed size determination. These results expand our understanding of seed size regulation and help to uncover the developmental and molecular basis underlying maternal control of seed size in maize.
Keywords: Endosperm; gene expression; maize; maternal effect; seed development; seed size..
© The Author 2016. Published by Oxford University Press on behalf of the Society for Experimental Biology.
Figures
Similar articles
-
Imprinted gene expression in maize starchy endosperm and aleurone tissues of reciprocal F1 hybrids at a defined developmental stage.Genes Genomics. 2018 Jan;40(1):99-107. doi: 10.1007/s13258-017-0613-9. Epub 2017 Sep 30. Genes Genomics. 2018. PMID: 29892900
-
Parent-of-Origin-Effect rough endosperm Mutants in Maize.Genetics. 2016 Sep;204(1):221-31. doi: 10.1534/genetics.116.191775. Epub 2016 Jul 20. Genetics. 2016. PMID: 27440865 Free PMC article.
-
Phenotypic and Transcriptional Analysis of Divergently Selected Maize Populations Reveals the Role of Developmental Timing in Seed Size Determination.Plant Physiol. 2014 Jun;165(2):658-669. doi: 10.1104/pp.114.235424. Epub 2014 Apr 7. Plant Physiol. 2014. PMID: 24710068 Free PMC article.
-
Genetic analysis as a tool to investigate the molecular mechanisms underlying seed development in maize.Ann Bot. 2005 Sep;96(3):353-62. doi: 10.1093/aob/mci187. Epub 2005 Jul 5. Ann Bot. 2005. PMID: 15998629 Free PMC article. Review.
-
Maize endosperm development.J Integr Plant Biol. 2021 Apr;63(4):613-627. doi: 10.1111/jipb.13069. Epub 2021 Mar 8. J Integr Plant Biol. 2021. PMID: 33448626 Review.
Cited by
-
Maternal control of seed weight in rapeseed (Brassica napus L.): the causal link between the size of pod (mother, source) and seed (offspring, sink).Plant Biotechnol J. 2019 Apr;17(4):736-749. doi: 10.1111/pbi.13011. Epub 2018 Nov 28. Plant Biotechnol J. 2019. PMID: 30191657 Free PMC article.
-
Domesticated, Genetically Engineered, and Wild Plant Relatives Exhibit Unintended Phenotypic Differences: A Comparative Meta-Analysis Profiling Rice, Canola, Maize, Sunflower, and Pumpkin.Front Plant Sci. 2017 Dec 5;8:2030. doi: 10.3389/fpls.2017.02030. eCollection 2017. Front Plant Sci. 2017. PMID: 29259610 Free PMC article.
-
Expansin genes expression in growing ovaries and grains of sunflower are tissue-specific and associate with final grain weight.BMC Plant Biol. 2018 Dec 4;18(1):327. doi: 10.1186/s12870-018-1535-7. BMC Plant Biol. 2018. PMID: 30514222 Free PMC article.
-
Application of a high-resolution genetic map for chromosome-scale genome assembly and fine QTLs mapping of seed size and weight traits in castor bean.Sci Rep. 2019 Aug 16;9(1):11950. doi: 10.1038/s41598-019-48492-8. Sci Rep. 2019. PMID: 31420567 Free PMC article.
-
Over-expression of mutated ZmDA1 or ZmDAR1 gene improves maize kernel yield by enhancing starch synthesis.Plant Biotechnol J. 2018 Jan;16(1):234-244. doi: 10.1111/pbi.12763. Epub 2017 Jul 25. Plant Biotechnol J. 2018. PMID: 28557341 Free PMC article.
References
-
- Berger F, Grini PE, Schnittger A. 2006. Endosperm: an integrator of seed growth and development. Current Opinion in Plant Biology 9, 664–670. - PubMed
-
- Capitanio R, Gentinetta E, Motto M. 1983. Grain weight and its components in maize inbred lines. Maydica 28, 365–379.
MeSH terms
LinkOut - more resources
Full Text Sources
Other Literature Sources
