Effects of relative and absolute frequency in the spectral weighting of loudness
- PMID: 26827032
- PMCID: PMC4723418
- DOI: 10.1121/1.4939893
Effects of relative and absolute frequency in the spectral weighting of loudness
Abstract
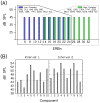
The loudness of broadband sound is often modeled as a linear sum of specific loudness across frequency bands. In contrast, recent studies using molecular psychophysical methods suggest that low and high frequency components contribute more to the overall loudness than mid frequencies. In a series of experiments, the contribution of individual components to the overall loudness of a tone complex was assessed using the molecular psychophysical method as well as a loudness matching task. The stimuli were two spectrally overlapping ten-tone complexes with two equivalent rectangular bandwidth spacing between the tones, making it possible to separate effects of relative and absolute frequency. The lowest frequency components of the "low-frequency" and the "high-frequency" complexes were 208 and 808 Hz, respectively. Perceptual-weights data showed emphasis on lowest and highest frequencies of both the complexes, suggesting spectral-edge related effects. Loudness matching data in the same listeners confirmed the greater contribution of low and high frequency components to the overall loudness of the ten-tone complexes. Masked detection thresholds of the individual components within the tone complex were not correlated with perceptual weights. The results show that perceptual weights provide reliable behavioral correlates of relative contributions of the individual frequency components to overall loudness of broadband sounds.
Figures


Similar articles
-
Contribution of frequency bands to the loudness of broadband sounds: Tonal and noise stimuli.J Acoust Soc Am. 2019 Jun;145(6):3586. doi: 10.1121/1.5111751. J Acoust Soc Am. 2019. PMID: 31255128 Free PMC article.
-
Contributions of individual components to the overall loudness of a multitone complex.J Acoust Soc Am. 2007 May;121(5 Pt1):2822-31. doi: 10.1121/1.2715456. J Acoust Soc Am. 2007. PMID: 17550181
-
Loudness perception of low tones undergoing partial masking by higher tones in orchestral music in concert halls.J Acoust Soc Am. 2012 Aug;132(2):799-803. doi: 10.1121/1.4729547. J Acoust Soc Am. 2012. PMID: 22894202
-
Development and current status of the "Cambridge" loudness models.Trends Hear. 2014 Oct 13;18:2331216514550620. doi: 10.1177/2331216514550620. Trends Hear. 2014. PMID: 25315375 Free PMC article. Review.
-
Stimulus intensity and loudness recruitment: neural correlates.J Acoust Soc Am. 1987 Jul;82(1):1-12. doi: 10.1121/1.395547. J Acoust Soc Am. 1987. PMID: 3305648 Review.
Cited by
-
Perceptual Weighting of Binaural Lateralization Cues across Frequency Bands.J Assoc Res Otolaryngol. 2020 Dec;21(6):485-496. doi: 10.1007/s10162-020-00770-3. Epub 2020 Sep 11. J Assoc Res Otolaryngol. 2020. PMID: 32915339 Free PMC article.
-
Enhanced salience of edge frequencies in auditory pattern recognition.Atten Percept Psychophys. 2024 Nov;86(8):2811-2820. doi: 10.3758/s13414-024-02971-x. Epub 2024 Oct 26. Atten Percept Psychophys. 2024. PMID: 39461935 Free PMC article.
-
Relative contributions of specific frequency bands to the loudness of broadband sounds.J Acoust Soc Am. 2017 Sep;142(3):1597. doi: 10.1121/1.5003778. J Acoust Soc Am. 2017. PMID: 28964048 Free PMC article.
-
Contribution of frequency bands to the loudness of broadband sounds: Tonal and noise stimuli.J Acoust Soc Am. 2019 Jun;145(6):3586. doi: 10.1121/1.5111751. J Acoust Soc Am. 2019. PMID: 31255128 Free PMC article.
-
Cross-frequency weights in normal and impaired hearing: Stimulus factors, stimulus dimensions, and associations with speech recognition.J Acoust Soc Am. 2021 Oct;150(4):2327. doi: 10.1121/10.0006450. J Acoust Soc Am. 2021. PMID: 34717459 Free PMC article.
References
-
- ANSI (2007). S3.4-2007, Procedure for the Computation of Loudness of Steady Sounds ( American National Standards Institute, New York: ).
-
- Chalupper, J. , and Fastl, H. (2002). “ Dynamic loudness model (DLM) for normal and hearing-impaired listeners,” Acta Acust. Acust. 88, 378–386.
Publication types
MeSH terms
Grants and funding
LinkOut - more resources
Full Text Sources
Other Literature Sources

