. 2016 May;10(5):719-34.
doi: 10.1016/j.molonc.2015.12.013. Epub 2016 Jan 2.

Melphalan-flufenamide is cytotoxic and potentiates treatment with chemotherapy and the Src inhibitor dasatinib in urothelial carcinoma

Affiliations

Melphalan-flufenamide is cytotoxic and potentiates treatment with chemotherapy and the Src inhibitor dasatinib in urothelial carcinoma

Kristina Viktorsson et al. Mol Oncol. 2016 May.

Abstract

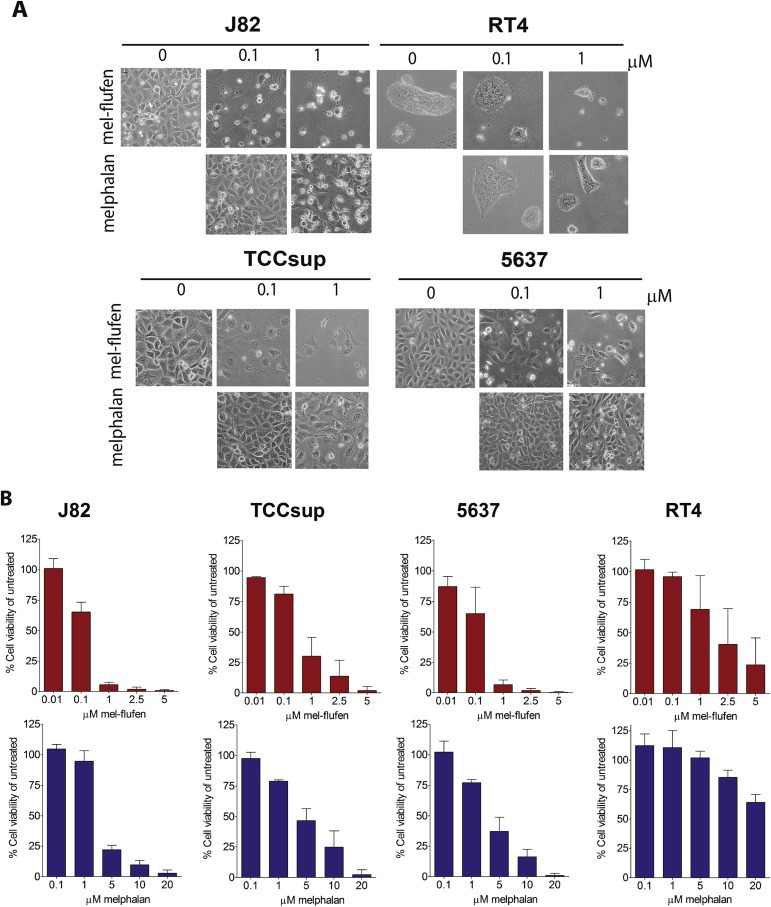
Background: Chemotherapy options in advanced urothelial carcinoma (UC) remain limited. Here we evaluated the peptide-based alkylating agent melphalan-flufenamide (mel-flufen) for UC.

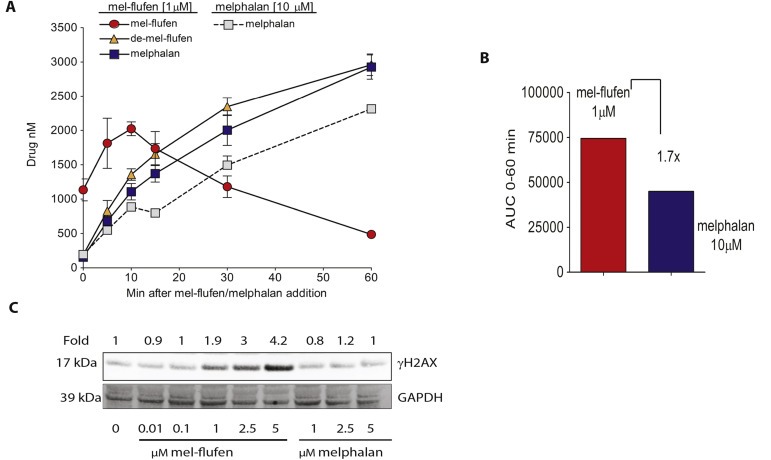
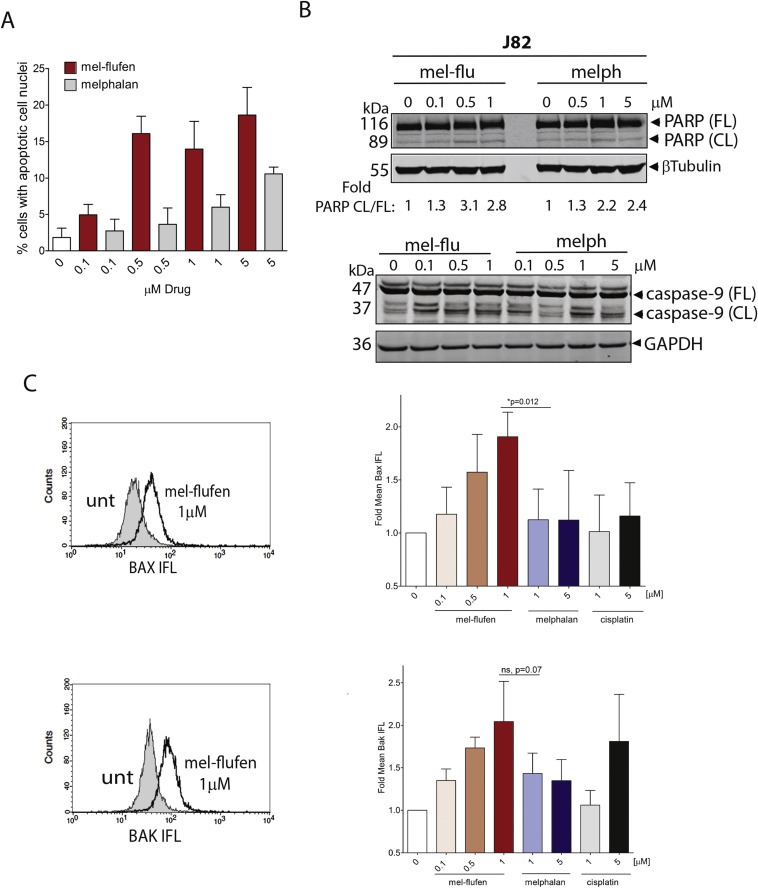
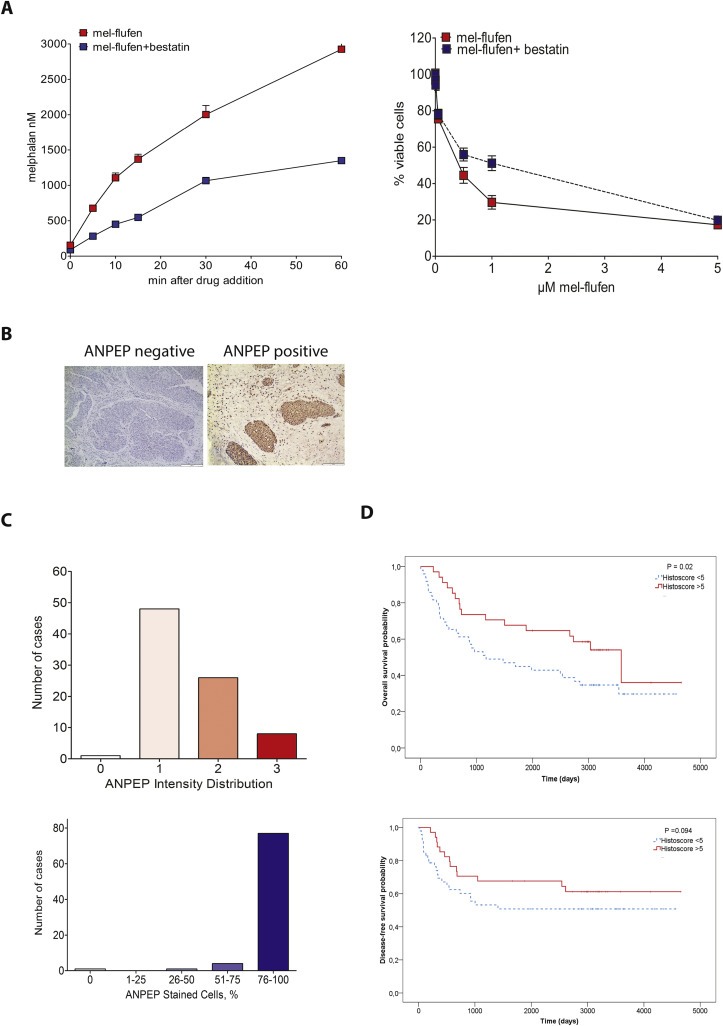
Methods: UC cell lines J82, RT4, TCCsup and 5637 were treated with mel-flufen, alone or combined with cisplatin, gemcitabine, dasatinib or bestatin. Cell viability (MTT assay), intracellular drug accumulation (liquid chromatography) apoptosis induction (apoptotic cell nuclei morphology, western blot analysis of PARP-1/caspase-9 cleavage and Bak/Bax activation) were evaluated. Kinome alterations were characterized by PathScan array and phospho-Src validated by western blotting. Aminopeptidase N (ANPEP) expression was evaluated in UC clinical specimens in relation to patient outcome.

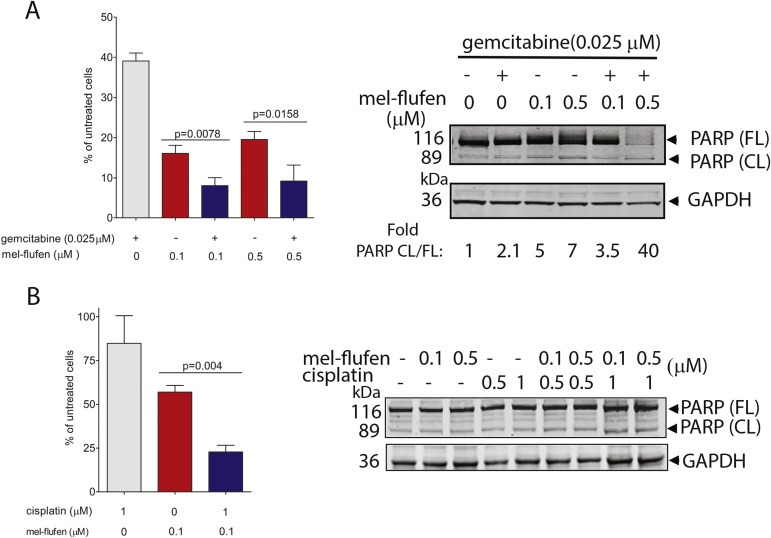
Results: In J82, RT4, TCCsup and 5637 UC cells, mel-flufen amplified the intracellular loading of melphalan in part via aminopeptidase N (ANPEP), resulting in increased cytotoxicity compared to melphalan alone. Mel-flufen induced apoptosis seen as activation of Bak/Bax, cleavage of caspase-9/PARP-1 and induction of apoptotic cell nuclei morphology. Combining mel-flufen with cisplatin or gemcitabine in J82 cells resulted in additive cytotoxic effects and for gemcitabine also increased apoptosis induction. Profiling of mel-flufen-induced kinome alterations in J82 cells revealed that mel-flufen alone did not inhibit Src phosphorylation. Accordingly, the Src inhibitor dasatinib sensitized for mel-flufen cytotoxicity. Immunohistochemical analysis of the putative mel-flufen biomarker ANPEP demonstrated prominent expression levels in tumours from 82 of 83 cystectomy patients. Significantly longer median overall survival was found in patients with high ANPEP expression (P = 0.02).

Conclusion: Mel-flufen alone or in combination with cisplatin, gemcitabine or Src inhibition holds promise as a novel treatment for UC.

Keywords: Aminopeptidase N; Apoptosis; Cisplatin; Dasatinib; Gemcitabine; Melphalan-flufenamide; Src; Urothelial carcinoma.


Figures

Figure 1
Figure 1
Mel‐flufen induces cytotoxicity in UC cells. J82, RT4, 5637 and TCC‐SUP UC cells were treated with mel‐flufen or melphalan for 72 h. (A) Photos showing cell morphology upon treatment. (B) Cell viability after 72 h of continuous treatments with either mel‐flufen (upper panel) or melphalan (lower panel). Data shown is the mean ± SD from 3 experiments. The ratio between mel‐flufen and melphalan for the cell lines is presented in Supplementary Figure. S1.
Figure 2
Figure 2
Mel‐flufen treatment of UC cells results in increased loading of melphalan. J82 cells were treated with mel‐flufen (1 μM) or melphalan (10 μM). The intracellular concentration of mel‐flufen, de‐esterified mel‐flufen or melphalan was measured using HPLC‐MS/MS. (A) Solid line: intracellular concentration of mel‐flufen, de‐esterified mel‐flufen or melphalan after mel‐flufen treatment. Dotted line: intracellular concentration of melphalan after melphalan treatment. (B) AUC 0–60 min after mel‐flufen (1 μM) or melphalan (10 μM) treatment. Please note the 10‐fold difference in concentration and the 1.7 fold higher loading of melphalan after mel‐flufen treatment. (A–B) is based on 3 biological replicates. (C) γH2AX was examined in J82 cells after 1 h treatment of mel‐flufen or melphalan and 24 h post incubation in which GAPDH served as loading control.
Figure 3
Figure 3
Mel‐flufen induces apoptosis in UC cell lines. (A) J82 cells were treated with mel‐flufen (red bars) or melphalan (grey bars) for 1 h and post incubated for 48 h. The nuclear morphology of the cells was assessed by DAPI‐staining and subsequent visualization in the FL‐1 channel of a Fluorescence microscope. The percentage of cells showing apoptotic nuclear morphology of 200 cells examined is given. Results shown are the mean ± SD from three biological replicates. Statistical difference between mel‐flufen and melphalan were reached at doses 0.5 μM, 1 μM and 5 μM (P = 0.0009, P = 0.0087 and P = 0.002 respectively). (B) Apoptosis was confirmed in J82 cells by analysing PARP‐1 and caspase‐9 cleavage by western blot treated as in (A) β‐tubulin and GAPDH was used as loading control for PARP‐1 and caspase‐9 analyses respectively. For PARP, the fold ratio CL/FL was determined by densitometry and is presented. (C) Bak or Bax activation in J82 cells was analysed by flow cytometry after 1 h treatment with mel‐flufen or melphalan, or after 24 h with cisplatin. Left: histogram showing Bak or Bax activation as a shift to the right in the diagram. Filled: untreated; unfilled: mel‐flufen treated. Right: Fold Bax or Bak mean IFL is presented relative to untreated cells. Data shown are the mean ± SD from three biological replicates. Upper panel: Bax, t‐test mel‐flufen 1 μM vs. melphalan 1 μM P = 0.012. Lower panel: Bak, t‐test mel‐flufen 1 μM vs. melphalan 1  μM P = 0.07.
Figure 4
Figure 4
Combined mel‐flufen and gemcitabine or cisplatin treatment decreases cell survival in UC cells. (A) Left: J82 cells were treated with either mel‐flufen (0.1 or 0.5 μM), gemcitabine (0.025 μM), or a combination, during 1 h and post incubated for 72 h. The number of cells were counted using Trypan blue and is presented as % of untreated control. Data shown is the mean ± SD of three experiments. Student's t‐test was used to achieve the indicated P‐values. Right: PARP‐1 cleavage was examined in J82 cells after mel‐flufen, gemcitabine, and combined treatment. GAPDH was used as loading control. Fold ratio CL/FL PARP was determined by densitometry. (B) Left: J82 cells were treated with either mel‐flufen (0.1 μM) or cisplatin (1 μM) for 1 h and post incubated for another 48 h and counted as in (A). Right: PARP‐1 cleavage was examined in J82 cells after mel‐flufen, cisplatin, and their combination. GAPDH was used as loading control.
Figure 5
Figure 5
Kinome profiling of UC cells after mel‐flufen treatment reveal Src as a driver of mel‐flufen refractoriness and identifies possible combination regimen. (A) The phosphorylation status of kinases and growth factor receptors were profiled in J82 cell lysates after mel‐flufen (1 μM, 24 h), melphalan (1 μM, 24 h), or cisplatin (1 μM, 24 h) exposure using PathScan RTK signalling antibody array. The phosphorylation levels of the kinases in untreated J82 cells were arbitrary set to 100 and the values in the treated samples calculated accordingly. Red bars: kinases/growth factor receptors showing at least 1.3 fold increased phosphorylation level as compared to untreated cells; Green bars: kinases/growth factor receptors showing at least 1.3 fold decreased phosphorylation level as compared to untreated cells; Grey bars: non‐altered kinases/growth factor receptors. (B) Validation of Src phosphorylation at Y416 in J82 cells using western blot with GAPDH as loading control (upper panel). Quantification of Src phosphorylation in J82 cells after indicated treatments. The western blot values were obtained by densitometry of the bands and the PathScan RTK signalling antibody array from values obtained as in (A). (C) Left: J82 cells were treated with dasatinib for 48 h and effect on Src phosphorylation at Y416 was examined by western blot with GAPDH as loading control. Right: J82 cells were treated with 20 nM dasatinib for 16 h and thereafter, with mel‐flufen for 1 h and post incubated for 48 h. The effect on Src phosphorylation at Y416 was examined by western blot in which GAPDH was used as loading control. (D) J82 cells were treated as in (C, right) and effect on cell morphology (left) and cytotoxicity (right) examined. Left: Photos showing cell morphology after indicated treatments. Right: Cells were counted using Trypan blue and is depicted as % of untreated control. Data presented is the mean ± SD in three experiments. Student's t‐test was applied.
Figure 6
Figure 6
Mel‐flufen intracellular loading and cell death is controlled by aminopeptidases and Aminopeptidase N display increased expression in clinical UC specimens. (A) Left: J82 cells were treated with 1 μM mel‐flufen alone or in combination with 5 μM bestatin. The concentrations of melphalan were measured using HPLC‐MS/MS. Data shown is the mean of three biological replicates. Right: Mel‐flufen‐induced cytotoxicity ± bestatin (5 μM) was analysed in J82 cells at 72 h after 1 h pulse treatment with indicated doses of mel‐flufen using MTT‐assay. Data shown are the mean ± SD of three biological replicates. (B) Immunohistochemical staining of ANPEP in primary urothelial carcinoma. Micrographs of UC specimens determined as negative or positive for ANPEP staining. Scale bar = 200 and 100 μm, respectively. (C) Distribution of immunohistochemistry ANPEP staining intensity (upper) and semi‐quantitative scoring of number of positive cells (lower) in UC specimen from 83 patients. (D) ANPEP expression in relation to overall survival (top) and disease‐free survival (bottom) by Kaplan–Meier method. Days from cystectomy is stated. ANPEP expression was stratified as high (Histoscore > 5, red solid line) or low (Histoscore < 5, blue dotted line). High tumour expression was significantly associated with better OS (P = 0.02, upper panel), but not significant for DFS (P = 0.094, lower panel).

References

    1. Bambury, R.M. , Rosenberg, J.E. , 2013. Advanced urothelial carcinoma: overcoming treatment resistance through novel treatment approaches. Front Pharmacol. 4, 3 - PMC - PubMed
    1. Bellmunt, J. , Theodore, C. , Demkov, T. , Komyakov, B. , Sengelov, L. , Daugaard, G. , Caty, A. , Carles, J. , Jagiello-Gruszfeld, A. , Karyakin, O. , Delgado, F.M. , Hurteloup, P. , Winquist, E. , Morsli, N. , Salhi, Y. , Culine, S. , von der Maase, H. , 2009. Phase III trial of vinflunine plus best supportive care compared with best supportive care alone after a platinum-containing regimen in patients with advanced transitional cell carcinoma of the urothelial tract. J. Clin. Oncol. 27, 4454–4461. - PubMed
    1. Bellmunt, J. , Fougeray, R. , Rosenberg, J.E. , von der Maase, H. , Schutz, F.A. , Salhi, Y. , Culine, S. , Choueiri, T.K. , 2013. Long-term survival results of a randomized phase III trial of vinflunine plus best supportive care versus best supportive care alone in advanced urothelial carcinoma patients after failure of platinum-based chemotherapy. Ann. Oncol. 24, 1466–1472. - PubMed
    1. Berglund, Å. , Ullén, A. , Lisyanskaya, A. , Orlov, S. , Hagberg, H. , Tholander, B. , Lewensohn, R. , Nygren, P. , Spira, J. , Harmenberg, J. , Jerling, M. , Alvfors, C. , Ringbom, M. , Nordström, E. , Söderlind, K. , Gullbo, J. , 2015. First-in-human, phase I/IIa clinical study of the peptidase potentiated alkylator melflufen administered every three weeks to patients with advanced solid tumor malignancies. Invest. New Drugs. 33, 1232–1241. - PubMed
    1. Chauhan, D. , Ray, A. , Viktorsson, K. , Spira, J. , Paba-Prada, C. , Munshi, N. , Richardson, P. , Lewensohn, R. , Anderson, K.C. , 2013. In vitro and in vivo antitumor activity of a novel alkylating agent, melphalan-flufenamide, against multiple myeloma cells. Clin. Cancer Res. 19, 3019–3031. - PMC - PubMed

MeSH terms