

Epithelial cell fate in the nephron tubule is mediated by the ETS transcription factors etv5a and etv4 during zebrafish kidney development
- PMID: 26827902
- PMCID: PMC4783290
- DOI: 10.1016/j.ydbio.2016.01.035
Epithelial cell fate in the nephron tubule is mediated by the ETS transcription factors etv5a and etv4 during zebrafish kidney development
Abstract
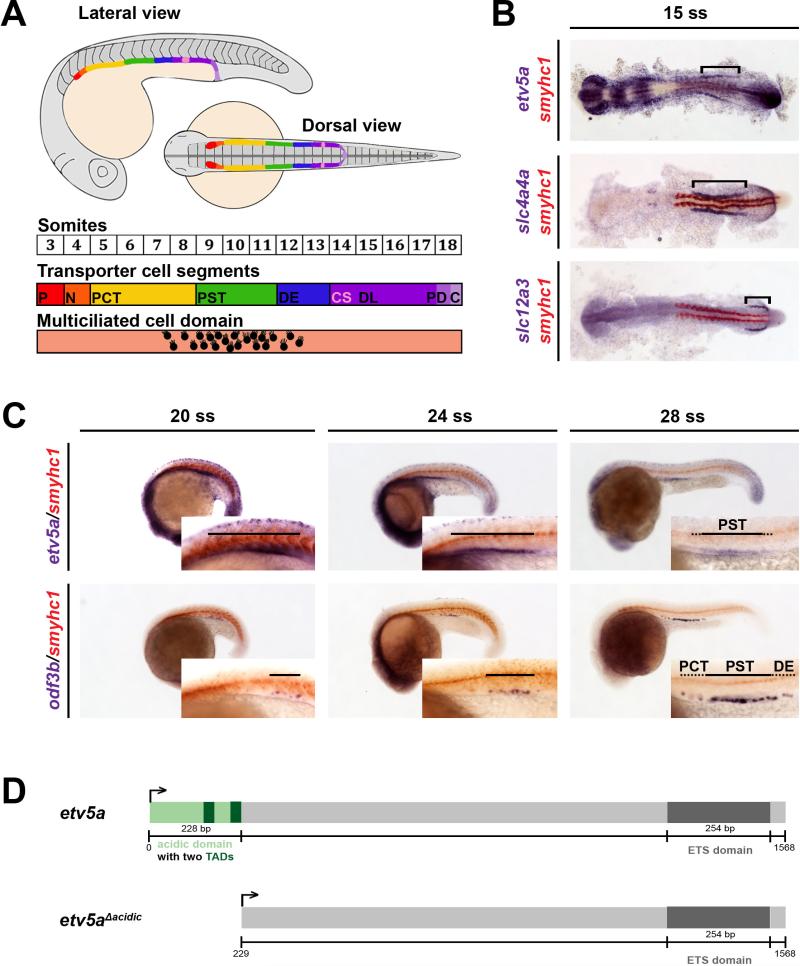
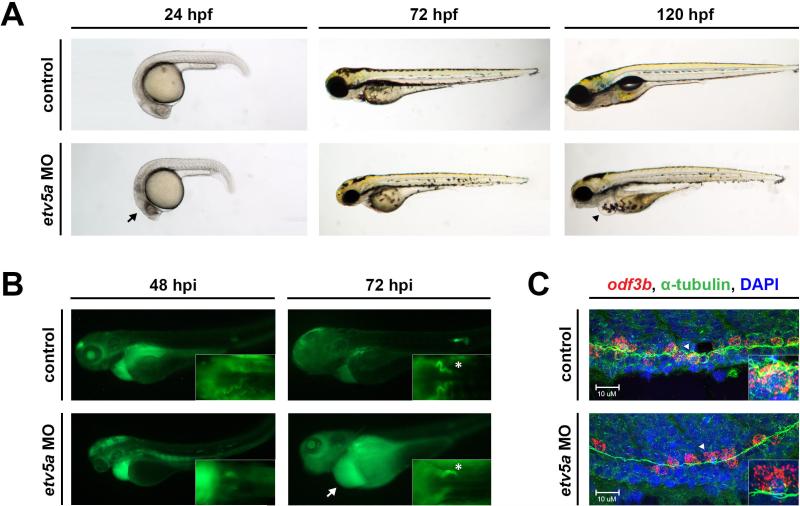
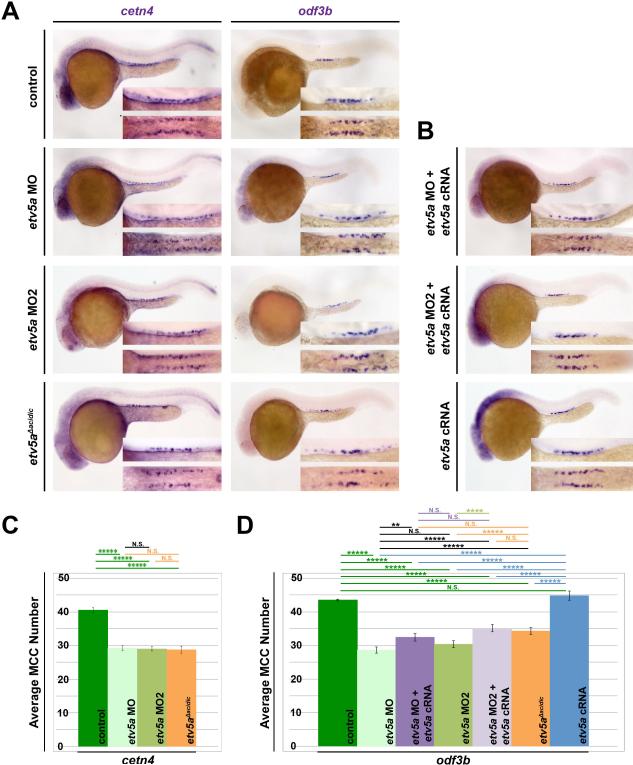
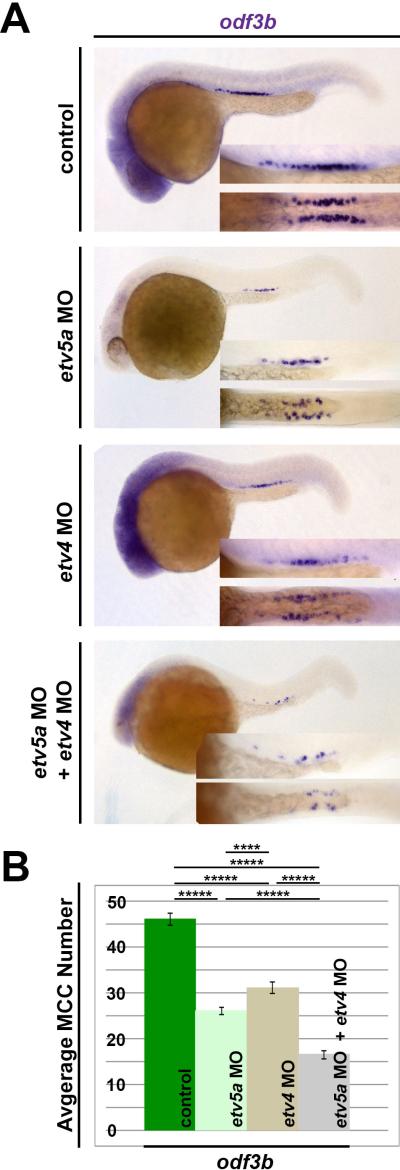
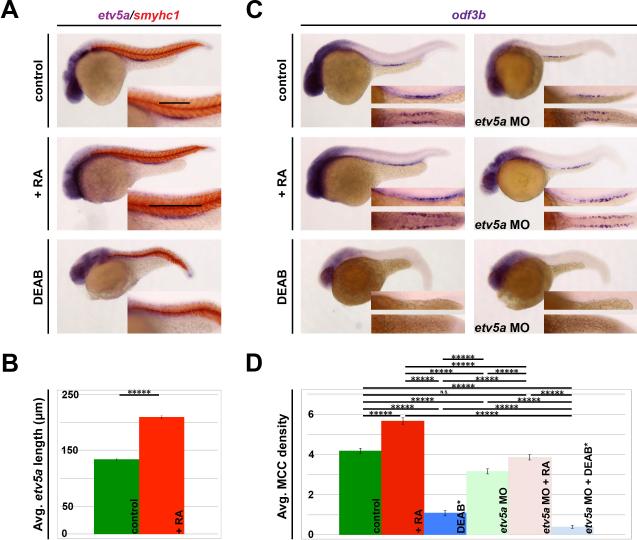
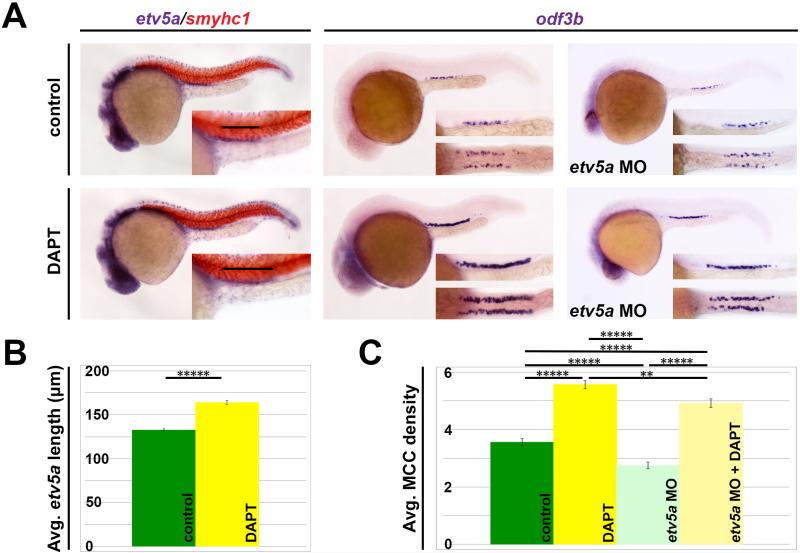
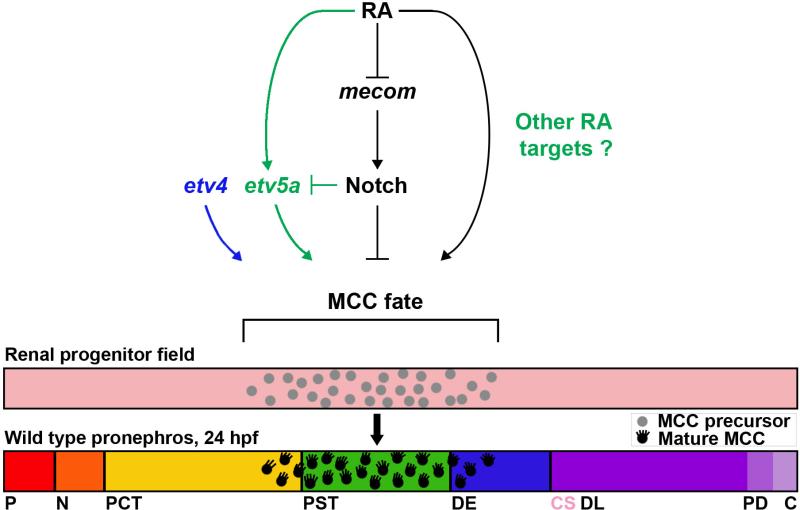
Kidney development requires the differentiation and organization of discrete nephron epithelial lineages, yet the genetic and molecular pathways involved in these events remain poorly understood. The embryonic zebrafish kidney, or pronephros, provides a simple and useful model to study nephrogenesis. The pronephros is primarily comprised of two types of epithelial cells: transportive and multiciliated cells (MCCs). Transportive cells occupy distinct tubule segments and are characterized by the expression of various solute transporters, while MCCs function in fluid propulsion and are dispersed in a "salt-and-pepper" fashion within the tubule. Epithelial cell identity is reliant on interplay between the Notch signaling pathway and retinoic acid (RA) signaling, where RA promotes MCC fate by inhibiting Notch activity in renal progenitors, while Notch acts downstream to trigger transportive cell formation and block adoption of an MCC identity. Previous research has shown that the transcription factor ets variant 5a (etv5a), and its closely related ETS family members, are required for ciliogenesis in other zebrafish tissues. Here, we mapped etv5a expression to renal progenitors that occupy domains where MCCs later emerge. Thus, we hypothesized that etv5a is required for normal development of MCCs in the nephron. etv5a loss of function caused a decline of MCC number as indicated by the reduced frequency of cells that expressed the MCC-specific markers outer dense fiber of sperm tails 3b (odf3b) and centrin 4 (cetn4), where rescue experiments partially restored MCC incidence. Interestingly, deficiency of ets variant 4 (etv4), a related gene that is broadly expressed in the posterior mesoderm during somitogenesis stages, also led to reduced MCC numbers, which were further reduced by dual etv5a/4 deficiency, suggesting that both of these ETS factors are essential for MCC formation and that they also might have redundant activities. In epistatic studies, exogenous RA treatment expanded the etv5a domain within the renal progenitor field and RA inhibition blocked etv5a in this populace, indicating that etv5a acts downstream of RA. Additionally, treatment with exogenous RA partially rescued the reduced MCC phenotype after loss of etv5a. Further, abrogation of Notch with the small molecule inhibitor DAPT increased the renal progenitor etv5a expression domain as well as MCC density in etv5a deficient embryos, suggesting Notch acts upstream to inhibit etv5a. In contrast, etv4 levels in renal progenitors were unaffected by changes in RA or Notch signaling levels, suggesting a possible non-cell autonomous role during pronephros formation. Taken together, these findings have revealed new insights about the genetic mechanisms of epithelial cell development during nephrogenesis.
Keywords: Epithelial cell fate; Kidney; Multiciliated cells; Nephrogenesis; Notch signaling; Pronephros; Retinoic acid; etv4; etv5a.
Copyright © 2016 The Authors. Published by Elsevier Inc. All rights reserved.
Figures
Similar articles
-
Zebrafish nephrogenesis is regulated by interactions between retinoic acid, mecom, and Notch signaling.Dev Biol. 2014 Feb 1;386(1):111-22. doi: 10.1016/j.ydbio.2013.11.021. Epub 2013 Dec 3. Dev Biol. 2014. PMID: 24309209 Free PMC article.
-
Nephron proximal tubule patterning and corpuscles of Stannius formation are regulated by the sim1a transcription factor and retinoic acid in zebrafish.Dev Biol. 2015 Mar 1;399(1):100-116. doi: 10.1016/j.ydbio.2014.12.020. Epub 2014 Dec 25. Dev Biol. 2015. PMID: 25542995 Free PMC article.
-
Iroquois transcription factor irx2a is required for multiciliated and transporter cell fate decisions during zebrafish pronephros development.Sci Rep. 2019 Apr 23;9(1):6454. doi: 10.1038/s41598-019-42943-y. Sci Rep. 2019. PMID: 31015532 Free PMC article.
-
Kidney organogenesis in the zebrafish: insights into vertebrate nephrogenesis and regeneration.Wiley Interdiscip Rev Dev Biol. 2013 Sep-Oct;2(5):559-85. doi: 10.1002/wdev.92. Epub 2012 Oct 16. Wiley Interdiscip Rev Dev Biol. 2013. PMID: 24014448 Free PMC article. Review.
-
Zebrafish Pronephros Development.Results Probl Cell Differ. 2017;60:27-53. doi: 10.1007/978-3-319-51436-9_2. Results Probl Cell Differ. 2017. PMID: 28409341 Review.
Cited by
-
Analysis of the Expression of Neurotrophins and Their Receptors in Adult Zebrafish Kidney.Vet Sci. 2022 Jun 15;9(6):296. doi: 10.3390/vetsci9060296. Vet Sci. 2022. PMID: 35737348 Free PMC article.
-
Esrrγa regulates nephron and ciliary development by controlling prostaglandin synthesis.Development. 2023 May 15;150(10):dev201411. doi: 10.1242/dev.201411. Epub 2023 May 26. Development. 2023. PMID: 37232416 Free PMC article.
-
Advances in Understanding the Genetic Mechanisms of Zebrafish Renal Multiciliated Cell Development.J Dev Biol. 2022 Dec 21;11(1):1. doi: 10.3390/jdb11010001. J Dev Biol. 2022. PMID: 36648903 Free PMC article. Review.
-
Frataxin is essential for zebrafish embryogenesis and pronephros formation.Front Cell Dev Biol. 2024 Dec 11;12:1496244. doi: 10.3389/fcell.2024.1496244. eCollection 2024. Front Cell Dev Biol. 2024. PMID: 39723241 Free PMC article.
-
Transcriptomic profile of Pea3 family members reveal regulatory codes for axon outgrowth and neuronal connection specificity.Sci Rep. 2020 Oct 23;10(1):18162. doi: 10.1038/s41598-020-75089-3. Sci Rep. 2020. PMID: 33097800 Free PMC article.
References
-
- Anzenberger U, Bit-Avragim N, Rohr S, et al. Elucidation of megalin/LRP2-dependent endocytic transport processes in the larval zebrafish pronephros. J Cell Sci. 2006;119:2127–2137. - PubMed
-
- Brown LA, Amores A, Schilling TF, et al. Molecular characterization of the zebrafish PEA3 ETS-domain transcription factor. Oncogene. 1998;17:93–104. - PubMed
Publication types
MeSH terms
Substances
Grants and funding
LinkOut - more resources
Full Text Sources
Other Literature Sources
Molecular Biology Databases
