. 2016 Mar:196:33-51.
doi: 10.1016/j.chemphyslip.2016.01.002. Epub 2016 Jan 28.

Maximally asymmetric transbilayer distribution of anionic lipids alters the structure and interaction with lipids of an amyloidogenic protein dimer bound to the membrane surface

Affiliations

Maximally asymmetric transbilayer distribution of anionic lipids alters the structure and interaction with lipids of an amyloidogenic protein dimer bound to the membrane surface

Sara Y Cheng et al. Chem Phys Lipids. 2016 Mar.

Abstract

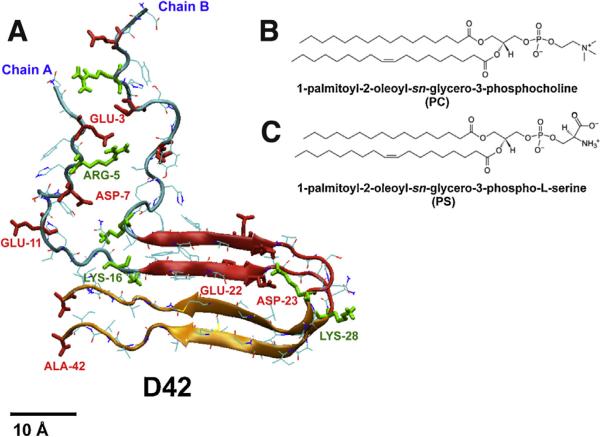
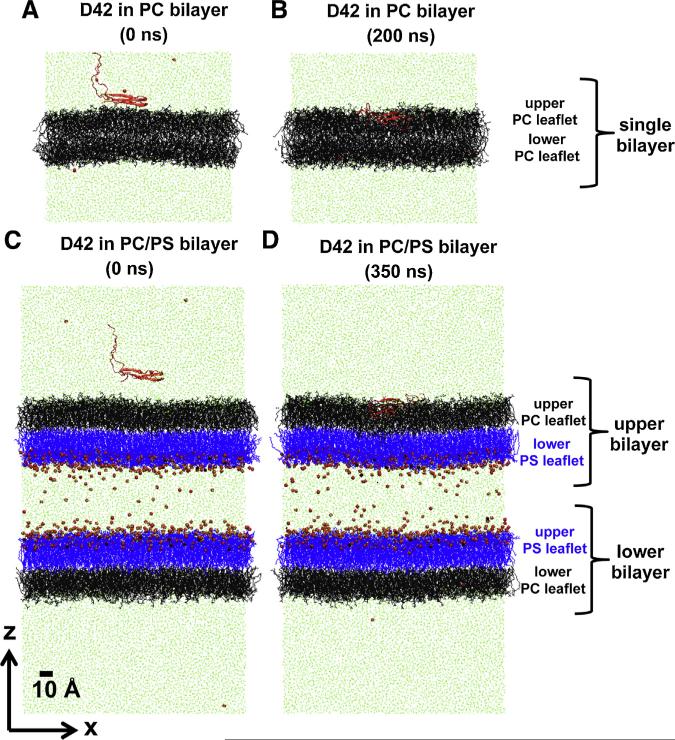
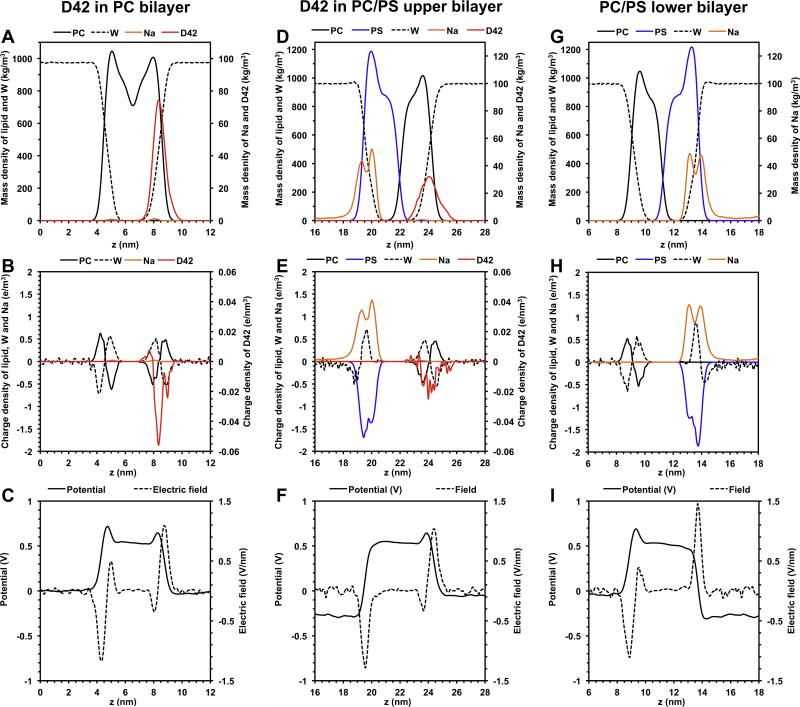
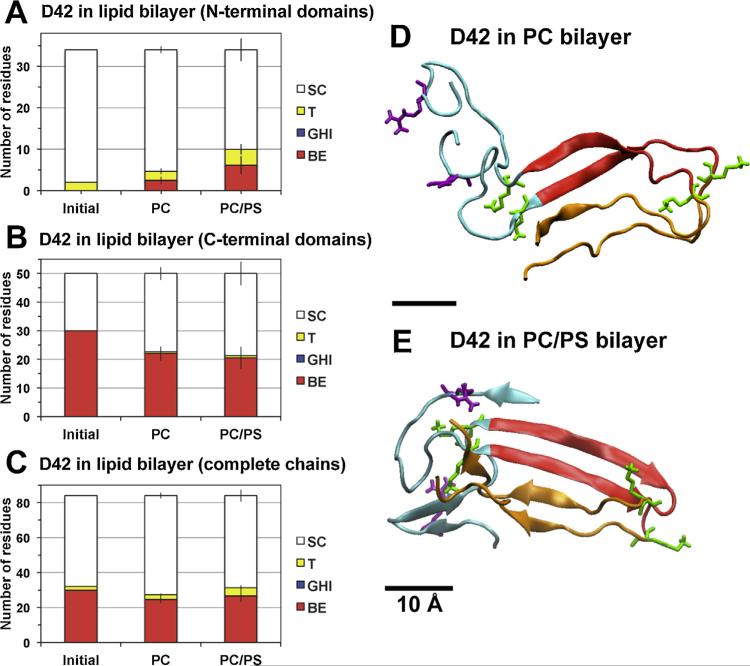
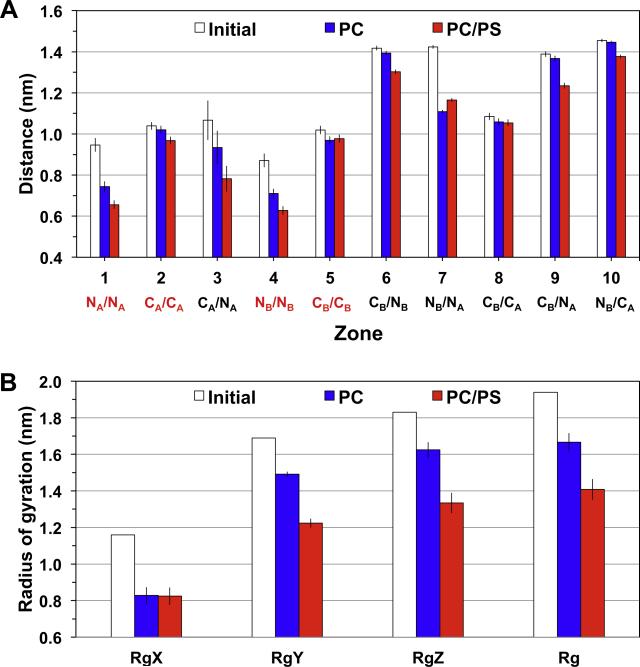
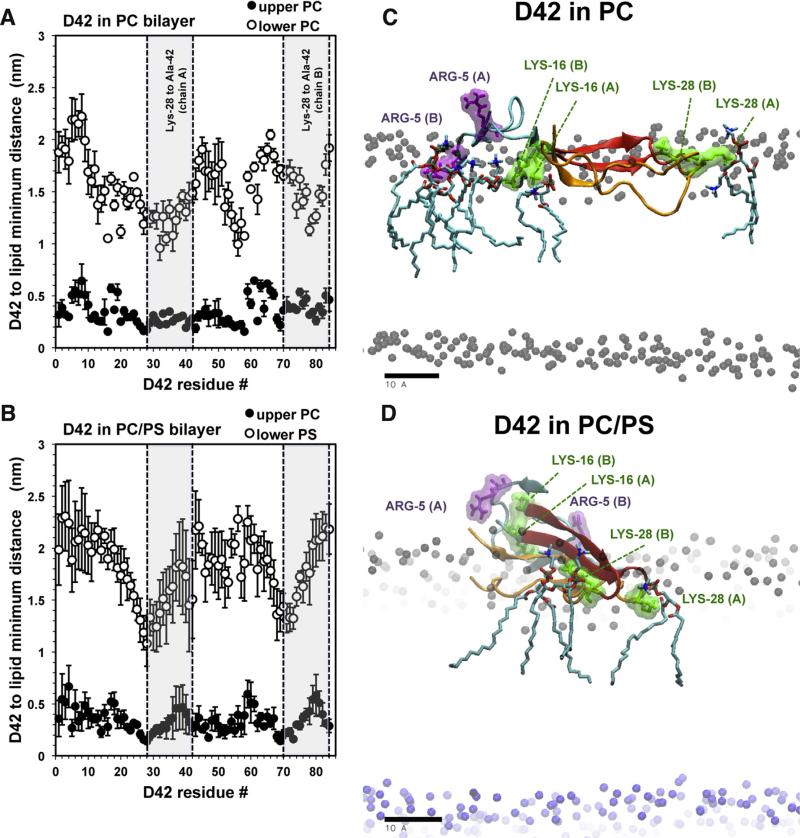
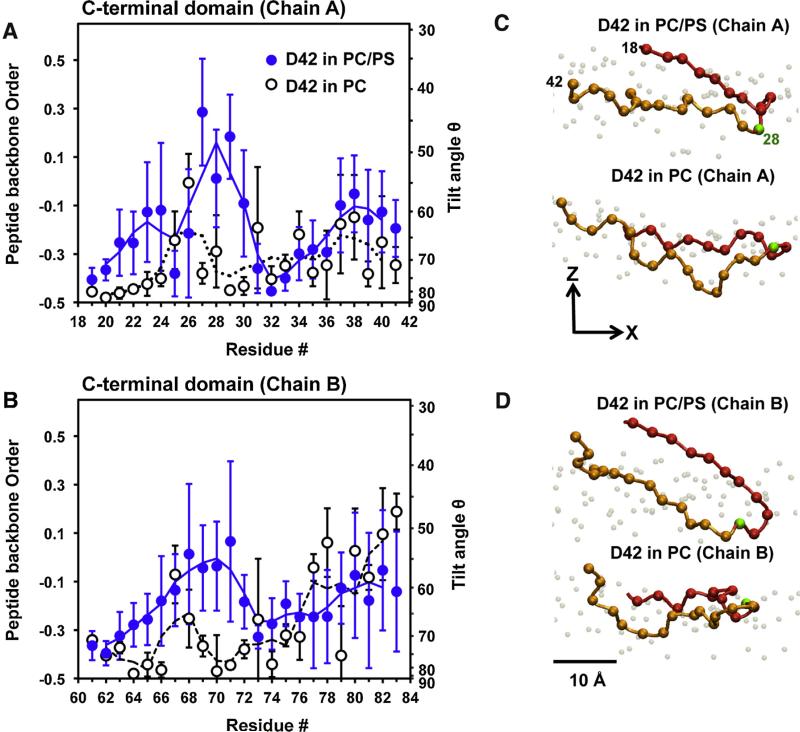
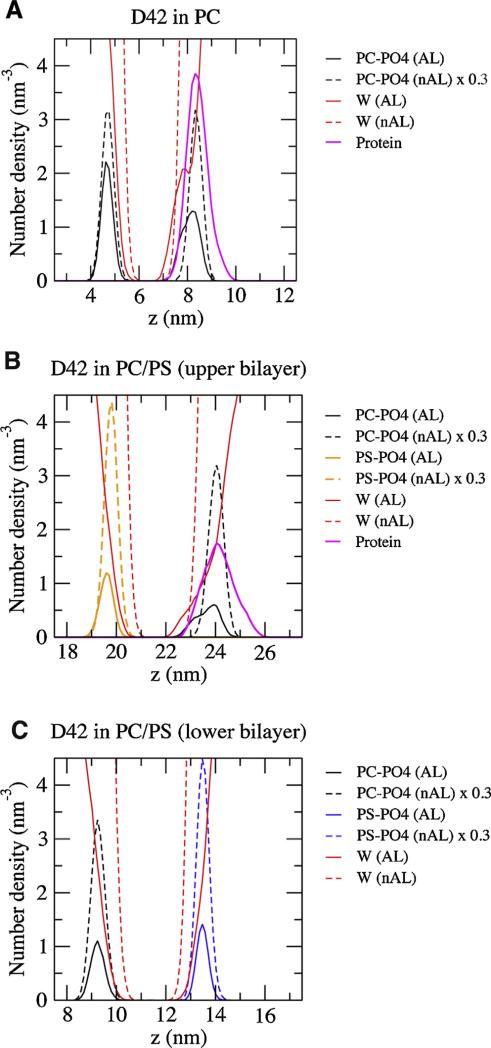
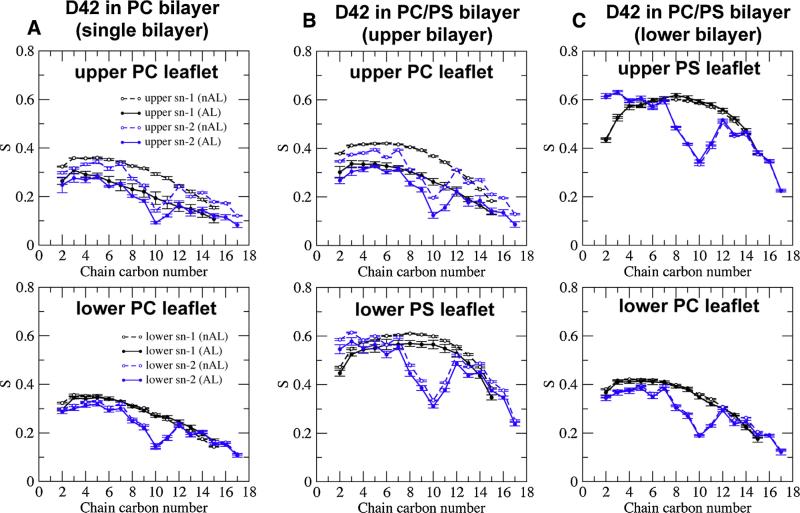
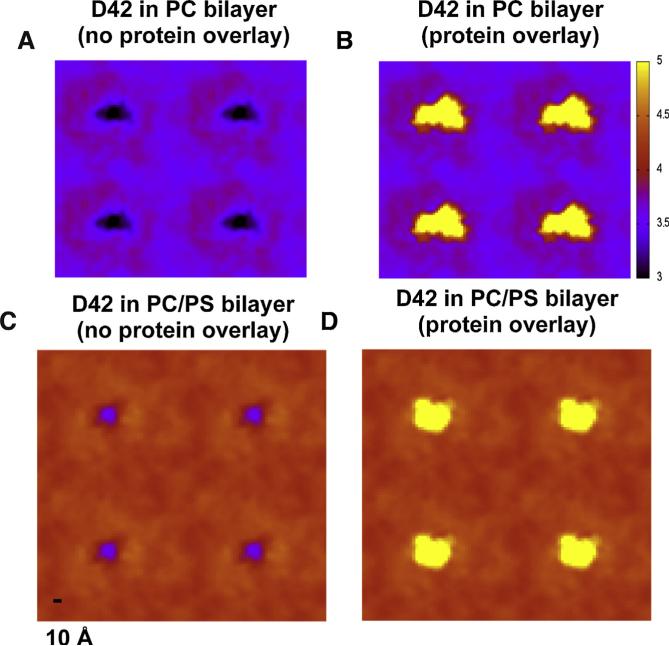
We used molecular dynamics simulations to explore the effects of asymmetric transbilayer distribution of anionic phosphatidylserine (PS) lipids on the structure of a protein on the membrane surface and subsequent protein-lipid interactions. Our simulation systems consisted of an amyloidogenic, beta-sheet rich dimeric protein (D42) absorbed to the phosphatidylcholine (PC) leaflet, or protein-contact PC leaflet, of two membrane systems: a single-component PC bilayer and double PC/PS bilayers. The latter comprised of a stable but asymmetric transbilayer distribution of PS in the presence of counterions, with a 1-component PC leaflet coupled to a 1-component PS leaflet in each bilayer. The maximally asymmetric PC/PS bilayer had a non-zero transmembrane potential (TMP) difference and higher lipid order packing, whereas the symmetric PC bilayer had a zero TMP difference and lower lipid order packing under physiologically relevant conditions. Analysis of the adsorbed protein structures revealed weaker protein binding, more folding in the N-terminal domain, more aggregation of the N- and C-terminal domains and larger tilt angle of D42 on the PC leaflet surface of the PC/PS bilayer versus the PC bilayer. Also, analysis of protein-induced membrane structural disruption revealed more localized bilayer thinning in the PC/PS versus PC bilayer. Although the electric field profile in the non-protein-contact PS leaflet of the PC/PS bilayer differed significantly from that in the non-protein-contact PC leaflet of the PC bilayer, no significant difference in the electric field profile in the protein-contact PC leaflet of either bilayer was evident. We speculate that lipid packing has a larger effect on the surface adsorbed protein structure than the electric field for a maximally asymmetric PC/PS bilayer. Our results support the mechanism that the higher lipid packing in a lipid leaflet promotes stronger protein-protein but weaker protein-lipid interactions for a dimeric protein on membrane surfaces.

Keywords: Asymmetric lipid membrane; Beta-amyloid; Molecular dynamics simulations; Protein aggregation; Protein structures on surfaces; Protein–lipid interactions.


Figures

Fig. 1
Fig. 1. Structures of protein and lipids
(For interpretation of the references to color in this figure legend, the reader is referred to the web version of this article.) The initial protein structure of D42 (A) consists of two 42-residue long peptide chains, chain A and chain B, with identical sequence (see Section 2). Each chain has a random-coil N-terminal domain (residues 1–17) and an U-shaped C-terminal domain (residues 18–42). The latter contains a compact beta-strand-to-loop-to-beta-strand-random coil (residues 18–28 in red and residues 29–42 in orange) motif. Four positively charged residues (N-terminal end amine, ARG-5, LYS-16 and LYS-28) and seven negatively charged residues (ASP–1, GLU–3, ASP–7, GLU–11, GLU–22, ASP–23 and C-terminal end carboxylate) in each chain are rendered in thick green and red licorice representations, respectively, and the non-charged residues are in thin color lines. A scale bar of 10 Å is shown. The chemical structures of the lipids, PC (B) and PS (C), are given. Here PC is zwitterionic and PS anionic, according to the charge distribution in the polar headgroup of each lipid.
Fig. 2
Fig. 2. Protein/lipid bilayer systems before and after simulation
(For interpretation of the references to color in this figure legend, the reader is referred to the web version of this article.) Representative initial (A, C) and final (B, D) simulated structures of protein/lipid bilayer systems containing PC (A, B) and PC/PS (C, D) lipid bilayers in the transverse-view (x–z plane view with z along the normal of the lipid bilayer) are shown at indicated simulation times. For clarity, a thin x–z slice with a thickness of Δy ≈ 5 nm of water/ion solution is presented to illustrate the total system size of each system. PC and PS lipids are in black and blue lines, respectively. Sodium ion and water molecules captured in the thin x–z slice are in small red spheres and light green lines, respectively. The protein D42 is shown in red ribbons. The definition of upper or lower lipid leaflet, and single, upper or lower bilayer is given. The upper PC leaflet of either the single PC bilayer (B) or the upper PC/PS bilayer (D) is defined as the protein-contact layer of this study. The scale bar indicates 10 Å.
Fig. 3
Fig. 3. Average transbilayer mass, charge, potential and electric field distribution of protein/lipid bilayer systems
The average mass (A, D), charge (B, E), potential (C, F) and electric field (C, F) distribution as a function of z distance of the protein/lipid bilayer systems containing PC bilayer (A–C) and PC/PS upper bilayer (D–F). The z-axis is along the normal of the lipid bilayer. The distributions of lipid bilayer/water system but without D42 for the PC/PS lower bilayer (G–I) are also shown. The calculatons were averaged over the last 50 ns and across all repeating replicates of each system.
Fig. 4
Fig. 4. Average secondary structure of protein in protein/lipid bilayer systems
(For interpretation of the references to color in this figure legend, the reader is referred to the web version of this article.) The average numbers of residues involved in reduced secondary structures (SC, T, GHI and BE) calculated from DSSP (see Section 2) for D42 in PC and PC/PS lipid bilayers in the N-terminal domains (A), C-terminal domains (B) and complete chains (C) are shown. The structural calculations were averaged over the last 50 ns of the simulation of each simulation replicate. The average was then across all four independent replicates of each lipid bilayer system with means and standard errors (bars) as given. For comparison, the initial (0 ns) reduced secondary structures of D42 are also presented. Protein conformations of representative replicates of D42 in PC (D) and PC/PS (E) bilayers at 200 and 350 ns simulation times, respectively, are illustrated. The N-terminal domain (residues 1–17 in blue ribbon) and C-terminal domain (residues 18–28 in red and residues 29–42 in orange) of each chain are shown. The six positively charged residues (lysine in green and arginine in purple) are in thick licorice lines. A scale bar of 10 Å is shown.
Fig. 5
Fig. 5. Average residue-contact distance and radii of gyration of D42 in protein/lipid bilayer systems
(For interpretation of the references to color in this figure legend, the reader is referred to the web version of this article.) Average residue-contact distances in 10 different residue-contact zones (A) and radii of gyration (B), along three principal components, RgX, RgY and RgZ, and their average, Rg, for the PC (blue) and PC/PS (red) bilayers are shown. The average was over the last 50 ns of each replicate and across all four repeating replicates with means and standard errors of the means (error bars) given. The values before the simulations, i.e., initial or 0 ns (white), are presented for comparison. The four contact zones (NA/NA, CA/CA, NB/NB and CB/CB) among residues within the same chain, i.e., chain A or chain B, are marked in red to facilitate the comparison among different zones in panel A. The definitions of the contact zones and radii of gyrations are given in Section 2.
Fig. 6
Fig. 6. Average residue-specific protein–lipid interactions in protein/lipid bilayer systems
(For interpretation of the references to color in this figure legend, the reader is referred to the web version of this article.) Average minimum distance between the atoms of D42 and the lipids in the upper (filled circles) and lower (open circles) layers of the PC (A) and PC/PS (B) bilayers versus residue number plots are shown. The average was over the last 50 ns of each simulation replicate and across all four repeating replicates with means and standard errors of the means (error bars) given. Note that residues numbers 1–42 and 43–84 represent chain A and chain B, respectively. Shaded areas highlighted the hydrophobic regions bound by Lys-28 and Ala-42 of chain A and chain B. Representative orientations of D42 on PC (C) and PC/PS (D) surfaces on the transverse (x–z) plane, with z-axis along the normal of the lipid bilayer, are shown. Also shown are the nearest PC lipids surrounding the positive residues (ARG-5 in purple and LYS-16 or LYS-28 in green) rendered in licorice lines and colored surfaces. To visualize the thickness of the bilayer, the polar phosphate groups of PC (black sphere) and PS (blue sphere) lipids highlight the upper and lower polar regions of the lipid bilayers, respectively. A scale bar indicates 10 Å.
Fig. 7
Fig. 7. Average residue-specific peptide backbone orientational order in protein/lipid bilayer systems
(For interpretation of the references to color in this figure legend, the reader is referred to the web version of this article.) Average orientational order and tilt angle of the C-alpha backbone in the C-terminal domain of chain A (A) and chain B (B) of D42 versus residue number in PC (black circles) and PC/PS (blue circles) bilayers are shown. See Section 2 for the details of the calculations of chain orientational order and tilt angle of the protein. The average was over the last 50 ns of each simulation replicate and across all four repeating replicates with the means and standard errors of the means (error bars) given. In panel B, residues numbers 60 to 84 of chain B correspond to the residues numbers 18 to 42 of chain A. For examples, residue number 70 and 84 in chain B correspond to residues 28 and 42 in chain B. The representative C-alpha carbon backbone orientations in the C-terminal domain of chain A (C) and chain B (D) of D42 in the PC and PC/PS bilayer on the transverse (x–z) plane, where z is the normal of the bilayer, are illustrated. For clarity, the C-alpha atoms from residues 17–27 (red balls), residue 28 (green ball) and residues 29–42 (orange balls) are color-coded. Also, the lipid phosphate atoms (gray balls) are shown to identify the polar regions of the PC leaflet in both PC and PC/PS bilayer. A scale bar indicates 10 Å
Fig. 8
Fig. 8. Average transbilayer density profile in protein/lipid bilayer systems
(For interpretation of the references to color in this figure legend, the reader is referred to the web version of this article.) Average number density of groups of molecules versus z-axis (normal of the bilayer) of the complexes containing the single PC bilayer (A), PC/PS upper bilayer (B), and PC/PS lower bilayer are shown. The average was over the last 50 ns of each simulation replicate and across all four repeating replicates of each replicate. The results for the upper PC/PS bilayer in which D42 was attached are shown. The non-annular (nAL) and annular (AL) lipid and water groups are in dashed and solid lines, respectively. The groups represent the phosphate of PC (PC–PO4) in black, the phosphate of PS (PS–PO4) in orange, the water (W) in red, and the protein in thick pink. The number densities of the lipids in the nAL region are scaled by a factor of 0.3 to facilitate the comparison of the density peak locations. The method of separation into AL and nAL regions has been described in Section 2.
Fig. 9
Fig. 9. Average orientational order parameter of lipid acyl chains in protein/lipid bilayer systems
(For interpretation of the references to color in this figure legend, the reader is referred to the web version of this article.) Average orientational order parameter (S) of the sn-1 (black) and sn-2 (blue) acyl chains of phospholipid versus chain carbon number in the upper (top row) or lower (bottom row) leaflet of the PC single bilayer (A), PC/PS upper bilayer (B) and PC/PS lower bilayer (C). The average was over the last 50 ns of each simulation replicate and across all four repeating replicates with means and standard errors of the means (error bars) shown. Order parameters of lipids in the annular (AL) and non-annular (nAL) regions labeled in filled and open circles, respectively, are given. The method of sorting the lipids into AL and nAL regions is described in Section 2. The definitions of upper and lower lipid leaflets are given in Fig. 2.
Fig. 10
Fig. 10. Average lipid bilayer thickness maps in protein/lipid bilayer systems
(For interpretation of the references to color in this figure legend, the reader is referred to the web version of this article.) Average three-dimensional thickness (color coded in z-dimension) maps of the PC bilayer (A, B) and the PC/PS bilayer (C, D), with (B, D) and without overlays (A, C) of protein locations (fixed at 6 nm thickness or yellow color-coded) are shown. The map calculations were averaged over the last 50 ns of each replicate and across all four repeating replicates in each system. A color scale bar from 3 to 5 nm (black to yellow) and a spatial scale bar of 1 nm on the lateral or x–y plane are given. See Section 2 for details of the thickness map calculations.gr1

Similar articles

Cited by

References

    1. Allen WJ, Lemkul JA, Bevan DR. GridMAT-MD: a grid-based membrane analysis tool for use with molecular dynamics. J. Comput. Chem. 2009;30:1952–1958. - PubMed
    1. Basyn F, Charloteaux B, Thomas A, Brasseur R. Prediction of membrane protein orientation in lipid bilayers: a theoretical approach. J. Mol. Graph Model. 2001;20:235–244. - PubMed
    1. Bekker H, Berendsen HJC, Dijkstra EJ, Achterop S, van Drunen R, van der Spoel D, Sijbers A, Keegstra H, Reitsma B, Renardus MKR. Physics Computing 92. World Scientific; Singapore: 1993. Gromacs: A Parallel Computer for Molecular Dynamics Simulations.
    1. Berendsen HD, van der Spoel D, van Drunen R. GROMACS: a messagepassing parallel molecular dynamics implementation. Comp. Phys. Comm. 1995;91:43–56.
    1. Berendsen HJC, Postma JPM, van Gunsteren WF, DiNola A, Haak JR. Molecular dynamics with coupling to an external bath. J. Chem. Phys. 1984;81:3684–3690.

Publication types

LinkOut - more resources