. 2016 Mar;22(3):262-9.
doi: 10.1038/nm.4040. Epub 2016 Feb 1.

Tumor cells can follow distinct evolutionary paths to become resistant to epidermal growth factor receptor inhibition

Affiliations

Tumor cells can follow distinct evolutionary paths to become resistant to epidermal growth factor receptor inhibition

Aaron N Hata et al. Nat Med. 2016 Mar.

Abstract

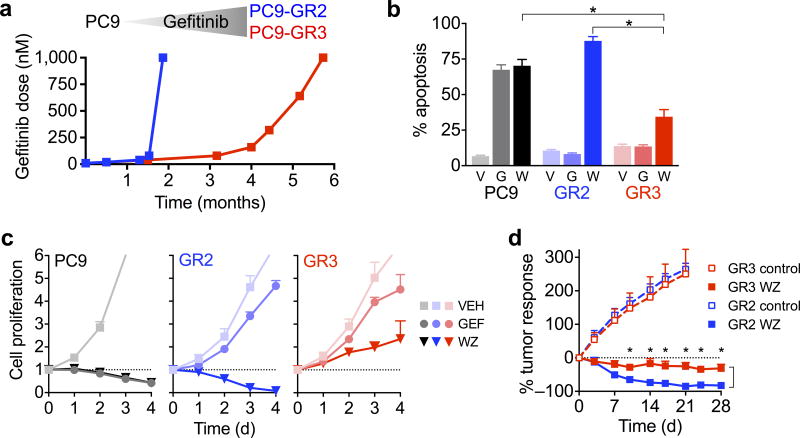
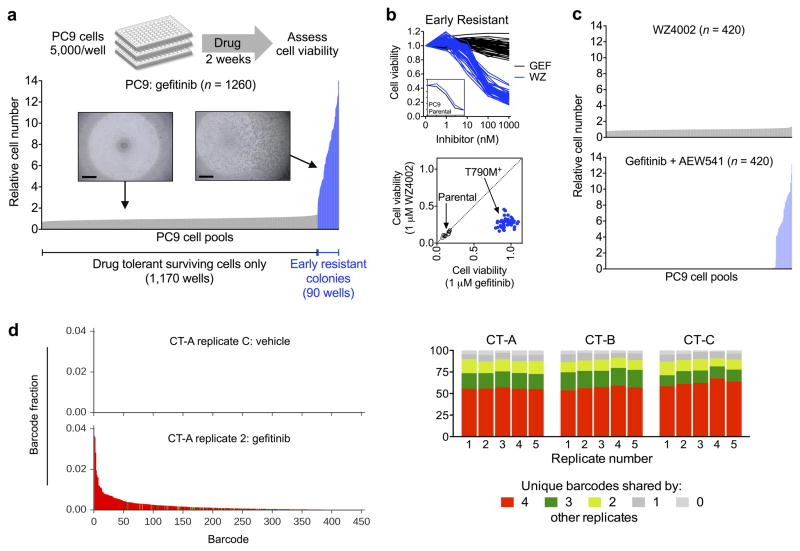
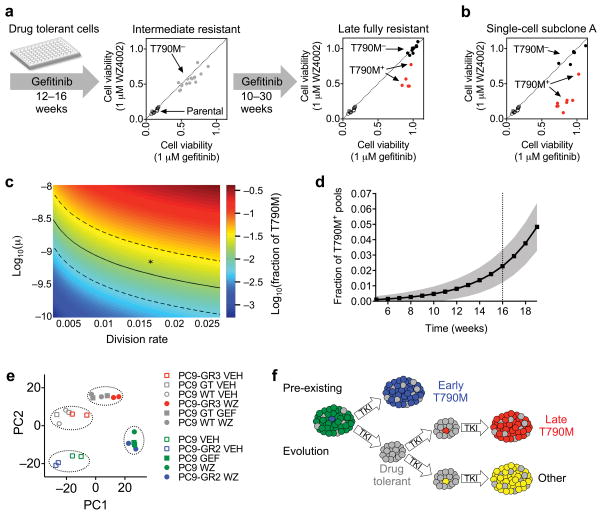
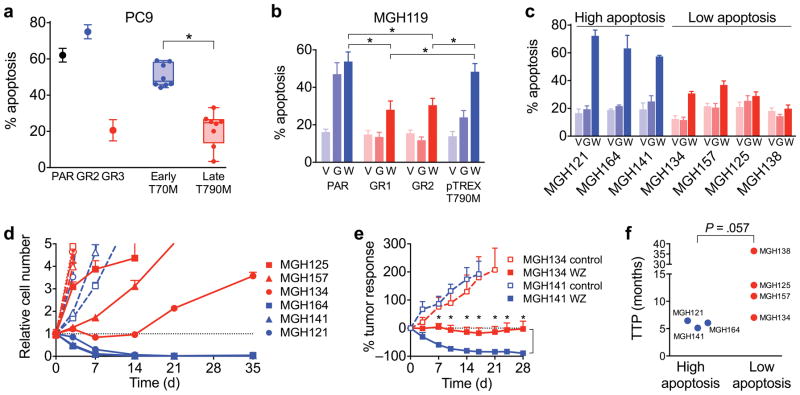
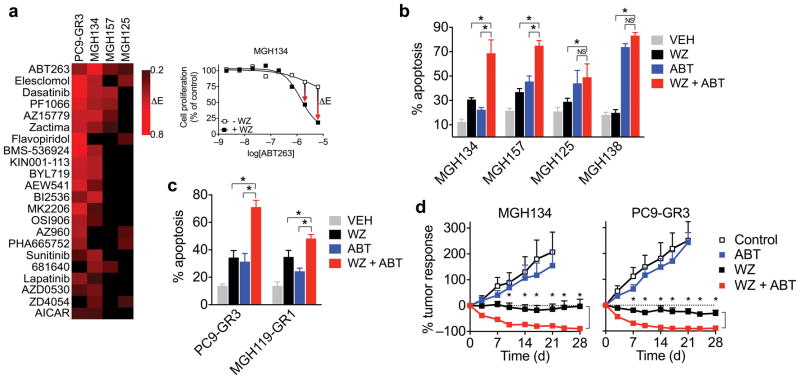
Although mechanisms of acquired resistance of epidermal growth factor receptor (EGFR)-mutant non-small-cell lung cancers to EGFR inhibitors have been identified, little is known about how resistant clones evolve during drug therapy. Here we observe that acquired resistance caused by the EGFR(T790M) gatekeeper mutation can occur either by selection of pre-existing EGFR(T790M)-positive clones or via genetic evolution of initially EGFR(T790M)-negative drug-tolerant cells. The path to resistance impacts the biology of the resistant clone, as those that evolved from drug-tolerant cells had a diminished apoptotic response to third-generation EGFR inhibitors that target EGFR(T790M); treatment with navitoclax, an inhibitor of the anti-apoptotic factors BCL-xL and BCL-2 restored sensitivity. We corroborated these findings using cultures derived directly from EGFR inhibitor-resistant patient tumors. These findings provide evidence that clinically relevant drug-resistant cancer cells can both pre-exist and evolve from drug-tolerant cells, and they point to therapeutic opportunities to prevent or overcome resistance in the clinic.


Conflict of interest statement

Competing financial interests

The authors declare competing financial interests: J.A.E. is a consultant for Novartis, Sanofi, Genentech, Clovis and Astra Zeneca; owns equity in Gatekeeper Pharmaceuticals, which has interest in T790M inhibitors; has research agreements with Novartis and Astra Zeneca. A.N.H. has provided consulting services for Amgen. M.J.N. has provided consulting services for Boehringer-Ingelheim. Z.P. has provided consulting services for Clovis Oncology and Boehringer-Ingelheim. L.V.S. has provided uncompensated consulting services to Clovis Oncology, AstraZeneca, Novartis, Boehringer-Ingelheim, Merrimack Pharmaceuticals, Genentech and Taiho Pharmaceuticals. H.C.B., V.K.R., C.L.K, D.A.R and and F.S. are employees of Novartis, Inc., as noted in the affiliations.

Figures

Figure 1
Figure 1. Variable sensitivity of resistant T790M PC9 cell lines to EGFR inhibition
(a) PC9 parental cells were cultured in escalating concentrations of gefitinib as tolerated until fully resistant, which was defined as lack of inhibitory effect of drug on cell proliferation. (b) PC9-GR3, PC9-GR2 and parental PC9 cells were cultured with 1 μM gefitinib (G), WZ4002 (W) or vehicle (V) for 72 hours and apoptosis was determined by annexin staining (mean and s.e.m. of four independent experiments*P < 0.05, two-tailed t-test.). (c) PC9-GR3, PC9-GR2 and parental PC9 cells were treated with 1 μM gefitinib (GEF), WZ4002 (WZ) or vehicle (VEH) and cell proliferation was determined by CellTiter-Glo assay at indicated time points (mean and s.e.m. of 4 independent experiments). The dotted line indicates relative cell number at time of drug addition. (d) Mice bearing PC9-GR2 or PC9-GR3 subcutaneous xenograft tumors were treated with 50 mg/kg/day WZ4002. (PC9-GR2 - control (N=8), WZ (N=8); PC9-GR3 - control (N=8), WZ (N=8)). Tumors were measured with electronic calipers and % tumor response was calculated as the percentage change in tumor volume (V = 0.52 × L × W2) relative to the start of drug treatment (mean and s.e.m.). P < 0.01 (*) comparing WZ treatment arms at indicated time points by multiple t-tests with Sidak-Bonferroni multiple comparison.
Figure 2
Figure 2. Early T790M acquired resistance results from selection of pre-existing T790M clones
(a) PC9 parental cell pools were treated with 300 nM gefitinib for two weeks and cell viability was determined by CellTiter-Glo assay. 7% of wells contained a rapidly proliferating resistant colony, while the remaining wells contained a small number of drug tolerant cells (inset, scale bar = 500 μm). Each bar represents one well; data shown are combined from two independent experiments and are normalized to the mean viability of drug tolerant wells. (b) 50 early resistant clones were treated with gefitinib (GEF) or WZ4002 (WZ) for 72 hours and cell viability determined (upper panel). Inset shows dose response of PC9 parental cells. Lower panel compares cell viability of each early resistant T790M clone after treatment with 1 μM WZ4002 or gefitinib relative to vehicle control. Diagonal axis indicates equal sensitivity to both drugs (e.g., non-T790M), whereas sensitivity to WZ4002 but not gefitinib (lower right quadrant) indicates T790M. Parental cells sensitive to both drugs are shown for comparison. (c) PC9 cell pools (5,000 cells) were treated with 1 μM WZ4002 or 300 nM gefitinib + 500 nM AEW541 for two weeks and cell viability determined. (d) The barcode distribution (fraction of each unique barcode in the total barcode reads) of one representative replicate of ClonTracer barcoded PC9 cells (CT-A) treated with gefitinib compared with vehicle treated control. The x-axes of the histograms are identical; each bar represents one unique barcode. Colors denote the number of other replicates in which the barcodes were identified as in Figure 2e. (e) Percentage of enriched barcodes shared by each replicate (1–5) for each independently barcoded experiment (CT-A, B, C).
Figure 3
Figure 3. Late emerging T790M acquired resistance results from evolution of drug tolerant cells
(a) PC9 cell pools comprised of only drug tolerant cells were cultured continuously in gefitinib and T790M status and sensitivity to gefitinib and WZ4002 were determined at the indicated time points (see Supplementary Fig 6a,b). (b) Pools of PC9 single cell-derived subclone A were cultured in gefitinib until fully resistant and T790M status and sensitivity to gefitinib and WZ4002 were determined (see Supplementary Fig. 7b). (c) The frequency of PC9 drug tolerant cell pools developing a T790M mutation during 16 weeks of drug treatment mathematically modeled as a function of varying mutational rates (μ) and cell division rates. Frequency values were calculated from the analytical solution of the mathematical model and are depicted as log10 of the fraction of wells predicted to develop T790M. Parameters that yield the experimentally observed frequency of 1.5% are indicated by the solid (mean) and dashed (95% confidence) lines. The asterisk denotes parameters used in Fig. 3d. The scale of the x-axis corresponds to a division rate of once every two weeks (low) to the rate of PC9 cells in the absence of drug (high). (d) Predicted frequency of acquiring T790M as a function of time (black line is mean, gray represents standard deviation). Parameters for drug tolerant cells: initial population size N0 = 150, birth rate b = 0.0162, death rate d = 0.015, mutation rate μ = 7×10⁻¹⁰. Birth and death rates of T790M mutant cells are br = 0.04 and dr = 0.0015, respectively. (e) Principal component analysis of transcriptional profiles of PC9 parental, drug tolerant (selected for 2 weeks in gefitinib (GT) or WZ4002 (WT), early T790M PC9-GR2 and late T790M PC9-GR3 cells determined by RNA-Seq. Prior to harvesting RNA, cells were treated with 1 μM gefitinib (GEF), WZ4002 (WZ) or vehicle (VEH) for 24 hours. (f) Model for development of T790M acquired resistance from pre-existing T790M cells as well as evolution of initially T790M-negative drug tolerant cells.
Figure 4
Figure 4. Late evolving T790M acquired resistance is associated with decreased apoptotic response to EGFR inhibition
(a) Late T790M PC9 resistant clones derived from parental and single cell-derived clones and early resistant T790M clones were treated with 1 μM WZ4002 and apoptosis determined. Each dot represents % apoptosis over vehicle control for an individual clone (mean of 4 independent experiments; *P < 0.05, two-tailed t-test). PAR = PC9 parental cells. (b) Gefitinib-resistant T790M MGH119 (GR1, GR2), MGH119-pTREX-T790M and parental MGH119 cells were treated with 1 μM gefitinib (G), WZ4002 (W) or vehicle (V) and apoptosis determined (mean and s.e.m. of 3 independent experiments; *P < 0.05, two-tailed t-test). (c) Patient-derived T790M EGFR mutant NSCLC cell lines were treated with gefitinib (G), WZ4002 (W) or vehicle (V) and apoptosis determined (mean and s.e.m. of 4 independent experiments). (d) Patient-derived cell lines with decreased apoptotic response were treated with 1 μM WZ4002 (closed symbols, solid lines) or vehicle (open symbols, dashed lines) and cell number determined by nuclear counting by high content imaging (mean and s.e.m. of four replicates). (e) Mice bearing MGH134 and MGH141 subcutaneous xenograft tumors were treated with 50 mg/kg/day WZ4002. (MGH134 - control (N=8), WZ (N=10); MGH141 - control (N=7), WZ (N=8)) P < 0.01 (*) comparing WZ treatment arms at indicated time points by multiple t-tests with Sidak-Bonferroni multiple comparison. (f) Time to progression (TTP) of patients from whom T790M patient-derived cell lines were established. TTP was determined by time from initiation of first line EGFR inhibitor therapy to first restaging scan showing definitive clinical progression of disease. Grouping of cell lines corresponds to Fig. 4c. Statistical significance was calculated using the Mann-Whitney U test.
Figure 5
Figure 5. Navitoclax enhances the apoptotic response of late resistant T790M cells with decreased sensitivity to EGFR inhibition
(a) Top drug hits from a combination drug screen that led to an enhancement of Emax when combined with WZ4002 in at least two of four T790M cell lines screened. The response of MGH134 cells to ABT-263 is shown as an example. (b) Patient-derived T790M cell lines were treated with 1μM WZ4002, ABT-263 or combination and apoptosis determined (mean and s.e.m. of 4 independent experiments; *P < 0.05, two-tailed t-test). (c) In vitro derived late T790M gefitinib resistant cell lines were treated with 1 μM WZ4002, ABT-263 or combination and apoptosis determined (mean and s.e.m. of 4 independent experiments; *P < 0.05, two-tailed t-test;). (d) Mice bearing MGH134 and PC9-GR3 subcutaneous xenograft tumors were treated with 100 mg/kg/day navitoclax and/or 50 mg/kg/day WZ4002. (MGH134 N=8 control, 10 WZ, 8 ABT, 7 WZ+ABT; PC9-GR3 N=8 control, 8 WZ, 7 ABT, 7 WZ+ABT). Control and WZ data from Figs. 1d and 4e are shown for comparison. P < 0.01 (*) comparing WZ and WZ + ABT treatment arms at indicated time points by multiple t-tests with Sidak-Bonferroni multiple comparison.

Comment in

Similar articles

Cited by

References

    1. Mok T, et al. Gefitinib or carboplatin-paclitaxel in pulmonary adenocarcinoma. N Engl J Med. 2009;361:947–957. - PubMed
    1. Maemondo M, et al. Gefitinib or chemotherapy for non-small-cell lung cancer with mutated EGFR. N Engl J Med. 2010;362:2380–2388. - PubMed
    1. Camidge DR, Pao W, Sequist LV. Acquired resistance to TKIs in solid tumours: learning from lung cancer. Nat Rev Clin Oncol. 2014;11:473–481. - PubMed
    1. Sequist LV, et al. Genotypic and histological evolution of lung cancers acquiring resistance to EGFR inhibitors. Science translational medicine. 2011;3:75ra26. - PMC - PubMed
    1. Pao W, et al. Acquired resistance of lung adenocarcinomas to gefitinib or erlotinib is associated with a second mutation in the EGFR kinase domain. PLoS Med. 2005;2:e73. - PMC - PubMed

Publication types

MeSH terms