Modeling of breath methane concentration profiles during exercise on an ergometer
- PMID: 26828421
- PMCID: PMC4913871
- DOI: 10.1088/1752-7155/10/1/017105
Modeling of breath methane concentration profiles during exercise on an ergometer
Abstract
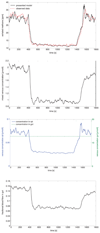
We develop a simple three compartment model based on mass balance equations which quantitatively describes the dynamics of breath methane concentration profiles during exercise on an ergometer. With the help of this model it is possible to estimate the endogenous production rate of methane in the large intestine by measuring breath gas concentrations of methane.
Figures


Similar articles
-
Exhaled methane concentration profiles during exercise on an ergometer.J Breath Res. 2015 Mar 9;9(1):016009. doi: 10.1088/1752-7155/9/1/016009. J Breath Res. 2015. PMID: 25749807 Free PMC article.
-
Physiological modeling of isoprene dynamics in exhaled breath.J Theor Biol. 2010 Dec 21;267(4):626-37. doi: 10.1016/j.jtbi.2010.09.028. Epub 2010 Sep 29. J Theor Biol. 2010. PMID: 20869370
-
The importance of methane breath testing: a review.J Breath Res. 2013 Jun;7(2):024001. doi: 10.1088/1752-7155/7/2/024001. Epub 2013 Mar 8. J Breath Res. 2013. PMID: 23470880 Review.
-
Stability of human methanogenic flora over 35 years and a review of insights obtained from breath methane measurements.Clin Gastroenterol Hepatol. 2006 Feb;4(2):123-9. doi: 10.1016/j.cgh.2005.11.006. Clin Gastroenterol Hepatol. 2006. PMID: 16469670 Review.
-
Measurement for breath concentration of hydrogen and methane in horses.J Vet Med Sci. 1999 Sep;61(9):1059-62. doi: 10.1292/jvms.61.1059. J Vet Med Sci. 1999. PMID: 10535514
Cited by
-
Modelling of Breath and Various Blood Volatilomic Profiles-Implications for Breath Volatile Analysis.Molecules. 2022 Apr 7;27(8):2381. doi: 10.3390/molecules27082381. Molecules. 2022. PMID: 35458579 Free PMC article.
-
Methane Exhalation Can Monitor the Microcirculatory Changes of the Intestinal Mucosa in a Large Animal Model of Hemorrhage and Fluid Resuscitation.Front Med (Lausanne). 2020 Oct 22;7:567260. doi: 10.3389/fmed.2020.567260. eCollection 2020. Front Med (Lausanne). 2020. PMID: 33195312 Free PMC article.
-
Beyond the Gut: Unveiling Methane's Role in Broader Physiological Systems.FASEB Bioadv. 2025 Aug 26;7(8):e70048. doi: 10.1096/fba.2025-00036. eCollection 2025 Aug. FASEB Bioadv. 2025. PMID: 40874065 Free PMC article. Review.
-
Detection of exhaled methane levels for monitoring trauma-related haemorrhage following blunt trauma: study protocol for a prospective observational study.BMJ Open. 2022 Jul 6;12(7):e057872. doi: 10.1136/bmjopen-2021-057872. BMJ Open. 2022. PMID: 35793921 Free PMC article.
-
Impairment of Mesenteric Perfusion as a Marker of Major Bleeding in Trauma Patients.J Clin Med. 2023 May 20;12(10):3571. doi: 10.3390/jcm12103571. J Clin Med. 2023. PMID: 37240677 Free PMC article. Review.
References
-
- Adams NG, Smith D, Paulson JF. An experimental survey of the reactions of ions (n = 0 to 4) with several diatomic and polyatomic molecules at 300 K. J Chem Phys. 1980;72:288–97.
-
- Anderson JC, Babb AL, Hlastala MP. Modeling soluble gas exchange in the airways and alveoli. Ann Biomed Eng. 2003;31:1402–22. - PubMed
-
- Boros M, Tuboly E, Mészáros A, Amann A. The role of methane in mammalian physiology—is it a gasotransmitter? J Breath Res. 2015;9:014001. - PubMed
-
- Chen O, et al. Methane attenuates myocardial ischemia injury in rats through anti-oxidative, anti-apoptotic and anti-inflammatory actions. Free Radical Biol Med. 2016;90:1–11. - PubMed
Publication types
MeSH terms
Substances
Grants and funding
LinkOut - more resources
Full Text Sources
Other Literature Sources
Medical
