

Peptide-Based Optical uPAR Imaging for Surgery: In Vivo Testing of ICG-Glu-Glu-AE105
- PMID: 26828431
- PMCID: PMC4734687
- DOI: 10.1371/journal.pone.0147428
Peptide-Based Optical uPAR Imaging for Surgery: In Vivo Testing of ICG-Glu-Glu-AE105
Abstract
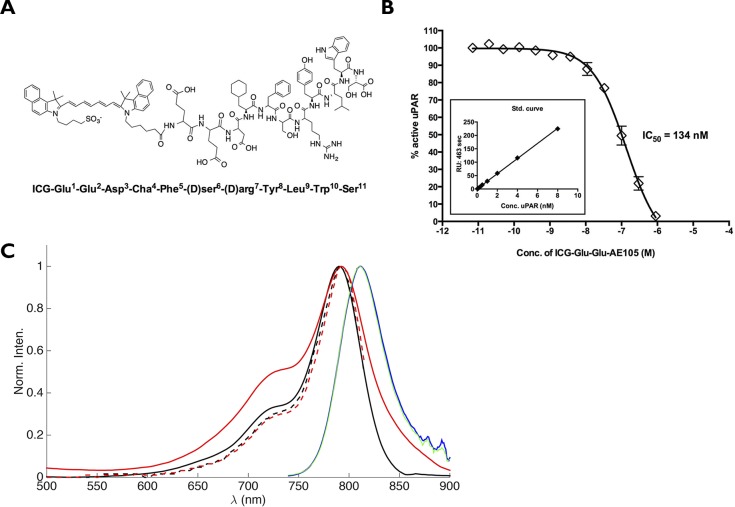
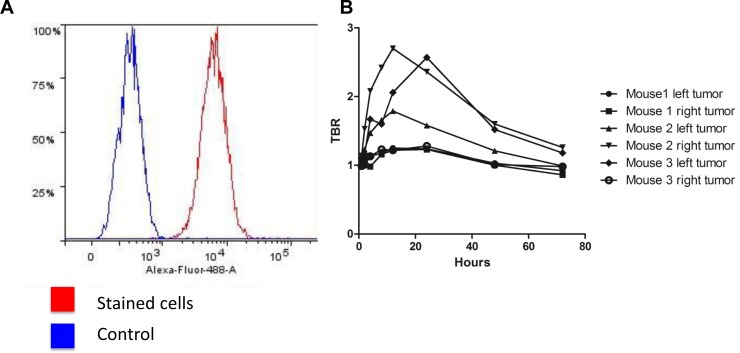
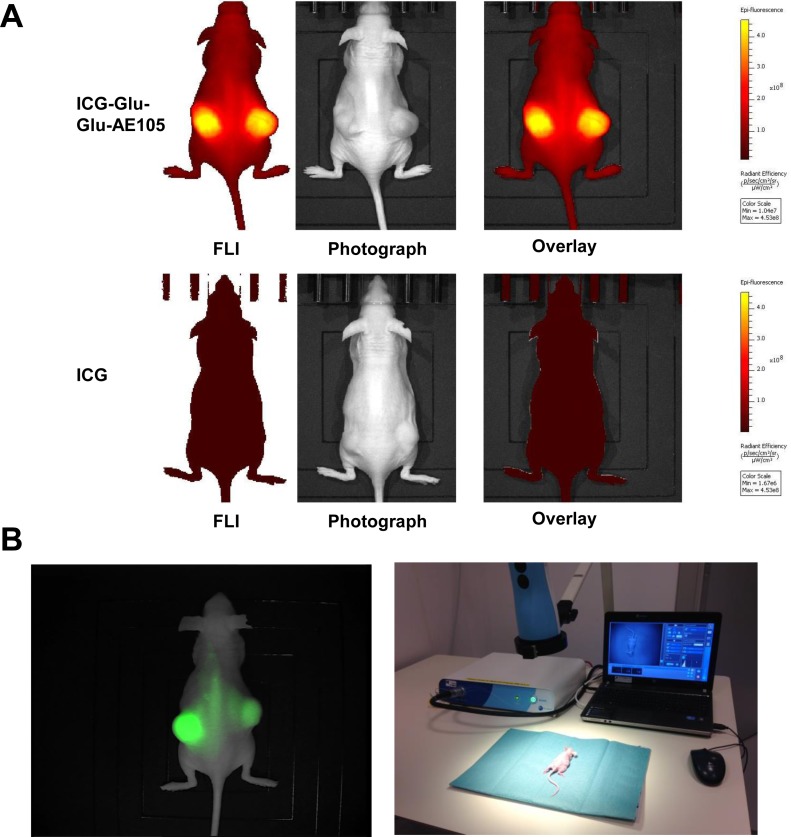
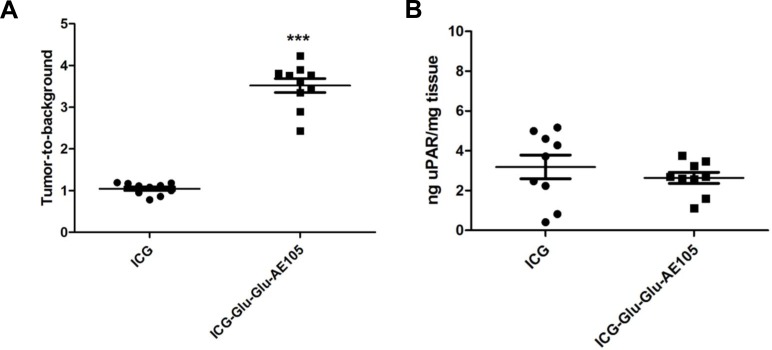
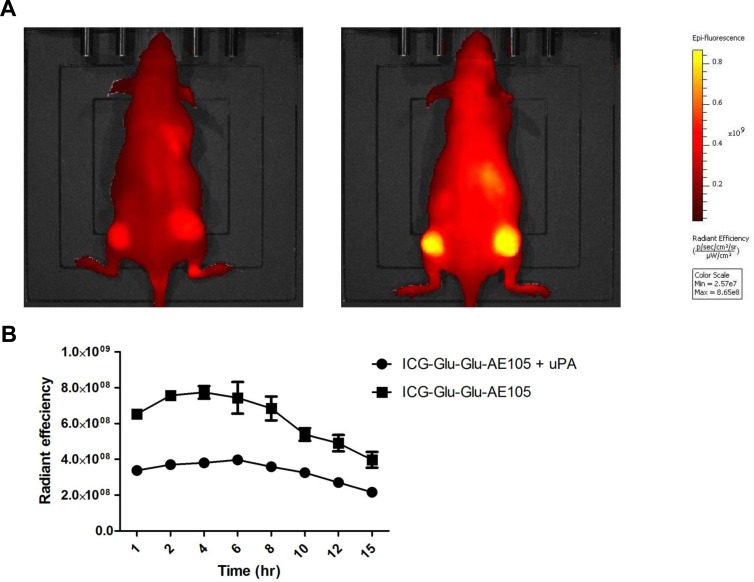
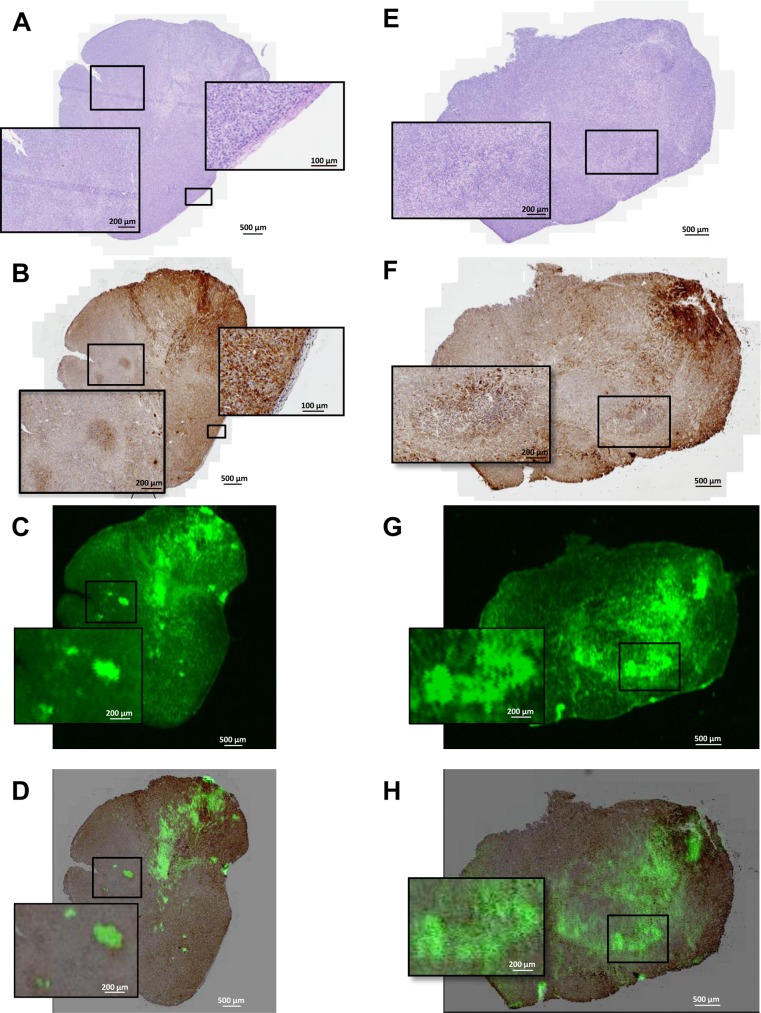
Near infrared intra-operative optical imaging is an emerging technique with clear implications for improved cancer surgery by enabling a more distinct delineation of the tumor margins during resection. This modality has the potential to increase the number of patients having a curative radical tumor resection. In the present study, a new uPAR-targeted fluorescent probe was developed and the in vivo applicability was evaluated in a human xenograft mouse model. Most human carcinomas express high level of uPAR in the tumor-stromal interface of invasive lesions and uPAR is therefore considered an ideal target for intra-operative imaging. Conjugation of the flourophor indocyanine green (ICG) to the uPAR agonist (AE105) provides an optical imaging ligand with sufficiently high receptor affinity to allow for a specific receptor targeting in vivo. For in vivo testing, human glioblastoma xenograft mice were subjected to optical imaging after i.v. injection of ICG-AE105, which provided an optimal contrast in the time window 6-24 h post injection. Specificity of the uPAR-targeting probe ICG-AE105 was demonstrated in vivo by 1) no uptake of unconjugated ICG after 15 hours, 2) inhibition of ICG-AE105 tumor uptake by a bolus injection of the natural uPAR ligand pro-uPA, and finally 3) the histological colocalization of ICG-AE105 fluorescence and immunohistochemical detected human uPAR on resected tumor slides. Taken together, our data supports the potential use of this probe for intra-operative optical guidance in cancer surgery to ensure complete removal of tumors while preserving adjacent, healthy tissue.
Conflict of interest statement
Figures
Similar articles
-
uPAR-targeted optical near-infrared (NIR) fluorescence imaging and PET for image-guided surgery in head and neck cancer: proof-of-concept in orthotopic xenograft model.Oncotarget. 2017 Feb 28;8(9):15407-15419. doi: 10.18632/oncotarget.14282. Oncotarget. 2017. PMID: 28039488 Free PMC article.
-
Molecular Targeted NIR-II Probe for Image-Guided Brain Tumor Surgery.Bioconjug Chem. 2018 Nov 21;29(11):3833-3840. doi: 10.1021/acs.bioconjchem.8b00669. Epub 2018 Oct 23. Bioconjug Chem. 2018. PMID: 30296054 Free PMC article.
-
New peptide receptor radionuclide therapy of invasive cancer cells: in vivo studies using 177Lu-DOTA-AE105 targeting uPAR in human colorectal cancer xenografts.Nucl Med Biol. 2012 Oct;39(7):962-9. doi: 10.1016/j.nucmedbio.2012.05.007. Epub 2012 Jun 26. Nucl Med Biol. 2012. PMID: 22739362
-
177Lu-Labeled DOTA-conjugated AE105 peptide (Asp-Cha-Phe-(d)Ser-(d)Arg-Tyr-Leu-Trp-Ser-CONH2).2012 Sep 13 [updated 2012 Nov 8]. In: Molecular Imaging and Contrast Agent Database (MICAD) [Internet]. Bethesda (MD): National Center for Biotechnology Information (US); 2004–2013. 2012 Sep 13 [updated 2012 Nov 8]. In: Molecular Imaging and Contrast Agent Database (MICAD) [Internet]. Bethesda (MD): National Center for Biotechnology Information (US); 2004–2013. PMID: 23166959 Free Books & Documents. Review.
-
NIR fluorescence-guided tumor surgery: new strategies for the use of indocyanine green.Int J Nanomedicine. 2019 Sep 25;14:7823-7838. doi: 10.2147/IJN.S207486. eCollection 2019. Int J Nanomedicine. 2019. PMID: 31576126 Free PMC article. Review.
Cited by
-
Selecting Targets for Tumor Imaging: An Overview of Cancer-Associated Membrane Proteins.Biomark Cancer. 2016 Sep 27;8:119-133. doi: 10.4137/BIC.S38542. eCollection 2016. Biomark Cancer. 2016. PMID: 27721658 Free PMC article. Review.
-
Targeting the Urokinase-Type Plasminogen Activator Receptor (uPAR) in Human Diseases With a View to Non-invasive Imaging and Therapeutic Intervention.Front Cell Dev Biol. 2021 Aug 20;9:732015. doi: 10.3389/fcell.2021.732015. eCollection 2021. Front Cell Dev Biol. 2021. PMID: 34490277 Free PMC article. Review.
-
Side-by-Side Comparison of uPAR-Targeting Optical Imaging Antibodies and Antibody Fragments for Fluorescence-Guided Surgery of Solid Tumors.Mol Imaging Biol. 2023 Feb;25(1):122-132. doi: 10.1007/s11307-021-01657-2. Epub 2021 Oct 12. Mol Imaging Biol. 2023. PMID: 34642899 Free PMC article.
-
Molecular imaging of the urokinase plasminogen activator receptor: opportunities beyond cancer.EJNMMI Res. 2020 Jul 28;10(1):87. doi: 10.1186/s13550-020-00673-7. EJNMMI Res. 2020. PMID: 32725278 Free PMC article. Review.
-
Optical molecular imaging in oral- and oropharyngeal squamous cell carcinoma using a novel uPAR-targeting near-infrared imaging agent FG001 (ICG-Glu-Glu-AE105): An explorative phase II clinical trial.Theranostics. 2025 Jan 1;15(1):52-67. doi: 10.7150/thno.100042. eCollection 2025. Theranostics. 2025. PMID: 39744227 Free PMC article. Clinical Trial.
References
-
- Atkins J, Mushawah FA, Appleton CM, Cyr AE, Gillanders WE, Aft RL, et al. Positive margin rates following breast-conserving surgery for stage IeIII breast cancer: palpable versus nonpalpable tumors. Journal of Surgical Research. Elsevier Ltd; September 1, 2012;177(1):109–115. 10.1016/j.jss.2012.03.045 - DOI - PMC - PubMed
-
- Swindle P, Eastham JA, Ohori M, Kattan MW, Wheeler T, Maru N, et al. Do Margins Matter? The Prognostic Significance of Positive Surgical Margins in Radical Prostatectomy Specimens. The Journal of Urology. September 2005;174(3):903–907. - PubMed
MeSH terms
Substances
LinkOut - more resources
Full Text Sources
Other Literature Sources
Medical
Miscellaneous
